Plain-language summary
- What it solves
- Artificial intelligence is not only software: it depends on chips, memory, data centres, power and cooling.
- Who it can serve
- Anyone wanting to understand what AI growth actually rests on, beyond the announcements.
- What it produces
- A picture of market movements across the whole supply chain.
Read the AI economy as a chain rather than a single stock or industry.
3 · What it produces
Market pulse plus hottest/coldest cards with z-scores and interpretation caveats.
How to read the latest output: A high z-score signals relative extension, not a certain reversal; the forecast cone represents uncertainty.
4 · How it works
From sources to output.
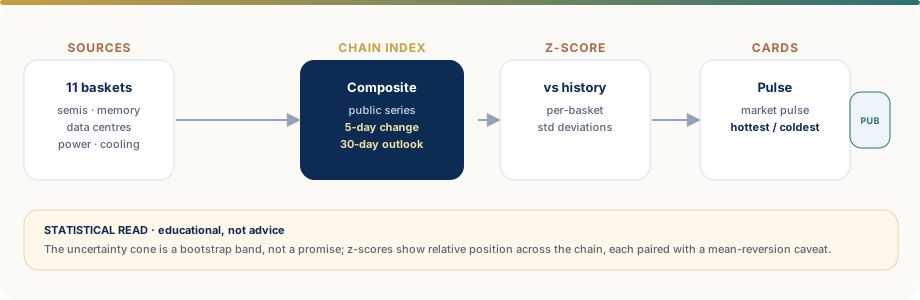
1Public series
2Baskets
3Index
4Outlook
5Z-scores
63 cards
5 · Data used
| Source | Variable | Frequency | Limitation |
|---|---|---|---|
| Public market series | 11 AI-chain baskets | Weekly | Listed proxies; basket composition may change |
Models and rules
Composite index, five-day returns, 30-day outlook, basket z-scores and bootstrap uncertainty.
Controls
Freshness gate, numeric fingerprint, exact and visual hashes, stale-card removal and independent bilingual publication.
Results and metrics
Model-versus-naïve comparison, outlook error and basket stability over time.
Limits
Financial proxies do not directly measure industrial orders, physical capacity or real demand.
Possible applications of the pattern
Thematic baskets and normalisation
Possible applications: value-chain, supplier, technology or asset analysis through coherent baskets and relative comparisons. Proxies must be documented and reviewed over time.
Transferable components
- versioned universe and baskets
- z-scores and rolling returns
- outlook and bootstrap
- network and diagnostics
Research questions
- basket robustness
- survivorship bias
- proxies vs physical data
- network stability
Workflow technical dossier
IMPLEMENTEDDescribes behaviour present in the workflow.EXTENSIONIndicates a possible check or evolution, not an operating feature.
Implementation detail and assessment criteria.
This section connects the visible output to data-engineering, modelling, validation and delivery choices present in the repository.
Architecture and data
Features and methods
- SMA20/50/200 trends, RSI, momentum, volatility, analyst upside and network signals.
- Two-state Gaussian HMM for regime; NetworkX for relationships and centrality; 0–100 multi-factor score.
- Half-Kelly sizing with caps, regime multiplier, ATR and trailing stops in the simulation layer.
Validation and failure modes
- Backtests, attribution, trade diagnostics and 30-day forecast history.
- Separation between research and ordinary runs; history synchronisation only after valid execution.
- Freshness and duplicate controls for bilingual social cards.
Runtime and delivery
- pandas, NumPy, SciPy, hmmlearn, NetworkX, yfinance and pandas-datareader.
- Jinja2, lxml, WeasyPrint/ReportLab, matplotlib and GitHub Actions.
10 · Operating timeline
Operating timeline
- Status: Active · experimental
- Frequency: Weekly
- Page updated: July 2026
11 · Technical detail
Method and assumptions
Composite index, five-day returns, 30-day outlook, basket z-scores and bootstrap uncertainty.
Main failure modes
Financial proxies do not directly measure industrial orders, physical capacity or real demand.
Publication governance
Freshness gate, numeric fingerprint, exact and visual hashes, stale-card removal and independent bilingual publication.
See real outputs
The Publications page reads the public Bluesky feed and shows up to three recent runs, including multiple images in one post.
Potential transferability
Have a problem similar to AI Supply Chain?
A first discussion can start from the objective, available data and success criterion without sending confidential information. A result observed here is not assumed to transfer automatically to another context.