Plain-language summary
- What it solves
- Energy crises build up on several fronts — prices, logistics, finance — usually watched separately.
- Who it can serve
- Anyone assessing overall energy risk without following a dozen indicators.
- What it produces
- A 0–100 index, the drivers behind it and how they move over time.
To separate the macro signal from the narrative: not one price, but a reproducible and auditable composite view.
3 · What it produces
A current gauge and a coordinated history of the drivers.
The gauge separates Calm, Watch, Stress and Crisis. Historical panels show whether Brent, TTF, VSTOXX, BTP-Bund, Supply Shock and Italian funding costs are rising or easing.
4 · How it works
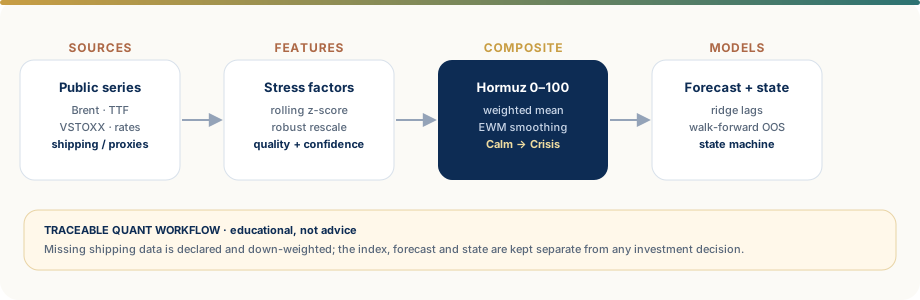
From public series to index and publication.
1Sources
2Quality
3Factors
40–100 index
5Forecast and state
6Publication
5 · Data used
| Source / series | Variable | Use | Handled limitation |
|---|---|---|---|
| Yahoo, Stooq, FRED, ECB | Brent, TTF, VSTOXX, BTP-Bund, Italy 10Y, gold | energy and financial stress | provider fallback, cache and freshness |
| World Bank Pink Sheet | fertiliser and urea | physical supply pressure | monthly frequency and declared forward fill |
| BDI, Cass Freight or vessel data | shipping and arrivals | logistics stress | if unavailable: 20-day Brent volatility with lower confidence |
Robust normalisation and lightweight ML
Rolling z-scores, robust/sigmoid rescaling, weighted mean normalised over available inputs and span-10 EWM. The three-month forecast uses ridge regression on 1, 5 and 20-day lags and lagged exogenous variables.
Opportunistic state machine
OFF → BUILD_UP → CRISIS → EXIT → RECOVERY → BACK_TO_OFF. Thresholds, index direction, driver confirmation and forecast govern the simulated allocation without conflating it with the communication card.
Walk-forward and comparison
Out-of-sample forecast metrics, Dynamic-versus-Static backtests, subperiod and stress-window analysis, drawdown, VaR/CVaR, Sortino, Calmar and HHI concentration.
A proxy, not a physical thermometer
Market series do not directly measure traffic through the Strait or actual availability. Shipping may be proxied; forecast and allocation remain experimental and are not advice.
Possible applications of the pattern
Composite stress indices with quality and operating state.
The pattern can transfer to supply chains, energy, country risk or operational continuity when components, weights, fallbacks and confidence are explicit.
Transferable components
- multi-provider adapters and SQLite cache
- robust normalisation and available-weight logic
- state machine and regime alerts
- paper trading and automated reports
Research questions
- quality of shipping proxies
- out-of-sample weight stability
- Dynamic versus Static
- recovery robustness
Workflow technical dossier
IMPLEMENTEDDescribes components present in the repository.EXPERIMENTALMarks models or choices still under validation.
AI, ML, RPA and quantitative engineering.
The workflow combines automated acquisition, feature engineering, statistical models, risk control, rendering and bilingual publication.
Architecture and automation
- Separate modules for data sources, cache, quality, features, signals, allocations, backtests, paper trading and reporting.
- GitHub Actions, cron, artifacts, email and AT Protocol; independent IT/EN posts with duplicate guard.
- SQLite for cache and persistent simulation; CSV/HTML/PDF/XLSX for audit.
Features and index
- Supply Shock from energy and fertilisers; Financial Stress from volatility, spreads and gold.
- Shipping Stress from real series or Brent volatility, down-weighted to 30% confidence.
- Availability-aware weights, 0–100 clipping and exponential smoothing.
ML, risk and research
- Ridge regression, walk-forward OOS, lagged features and quarterly forecasting.
- ATR, volatility targeting, drawdown governor, stop losses, scenarios and attribution.
- Universe research and dynamic-portfolio comparison with a static benchmark.
Stack
- pandas, NumPy, SciPy, scikit-learn, statsmodels and yfinance.
- requests, pandas-datareader, Beautiful Soup and lxml.
- Matplotlib, Pillow, Jinja2, ReportLab, openpyxl and PyYAML.
10 · Runtime
Automated cadence and bilingual outputs.
- Status: active · experimental
- Frequency: several weekly runs with an Italy-time guard
- Output: gauge, driver history, reports and paper trade
11 · Technical detail
Compact index formula
Each input is converted into a rolling z-score: zₜ = (xₜ − rolling mean) / rolling standard deviation. Sub-indices are then rescaled to 0–100. The final index is Hₜ = Σ(wᵢ · Sᵢ,ₜ) / Σwᵢ over available components only, clipped to 0–100 and smoothed with span-10 EWM. With real shipping data the weights are 0.42 supply, 0.28 shipping and 0.30 finance; with the Brent proxy they become 0.46, 0.14 and 0.40, with shipping confidence set to 0.30.
Main failure mode
Mistaking prices and proxies for physical availability or an investment signal.
Publication governance
Watermark, #LIwf6 tag, alt text, anti-duplicate state and two independent top-level posts.
See both images from the latest output.
The Publications page lets readers move from the gauge to the driver history within the same post.
Potential transferability
Have a problem similar to Energy Crisis Thermometer?
A first discussion can start from the objective, available data and success criterion without sending confidential information. A result observed here is not assumed to transfer automatically to another context.