Plain-language summary
- What it solves
- Markets produce too many contradictory signals to be read one by one.
- Who it can serve
- Anyone following markets who wants an overview that does not hide how uncertain it is.
- What it produces
- The current regime, forecasts, detected anomalies and a risk map.
Make a broad cross-asset picture readable without hiding uncertainty or baseline comparisons.
3 · What it produces
Regime, S&P 500 forecast, cross-asset anomalies and risk-on/risk-off.
How to read the latest output: The regime summarises current conditions; it is not a trading instruction. Directional probability should be read with track record and expected move.
4 · How it works
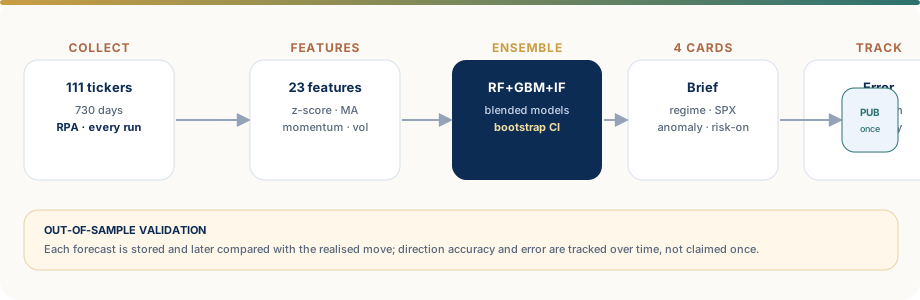
From sources to output.
5 · Data used
| Source | Variable | Frequency | Limitation |
|---|---|---|---|
| Public market series | Equities, rates, FX, volatility, commodities | Daily | Different calendars and timestamps |
| FRED when available | Macro variables | Source dependent | Publication lags and revisions |
Models and rules
Regime classification, supervised forecasting, Isolation Forest anomalies and a composite risk index.
Controls
Freshness, market calendar, model-baseline comparison, forecast history and duplicate guards.
Results and metrics
Directional accuracy, average move, errors, period stability and baseline comparison.
Limits
Unstable relationships, unseen shocks and the risk of over-simplifying heterogeneous conditions.
Possible applications of the pattern
Cross-source radar and regimes
Possible applications: monitoring KPI portfolios, recurring conditions and anomalies in operating contexts. Classifications should support review rather than automate decisions.
Workflow technical dossier
IMPLEMENTEDDescribes behaviour present in the workflow.EXTENSIONIndicates a possible check or evolution, not an operating feature.
Implementation detail and assessment criteria.
This section connects the visible output to data-engineering, modelling, validation and delivery choices present in the repository.
Architecture and data
- Cross-asset series aligned to market calendars with the date of the latest valid observation.
- A shared feature matrix feeds regime, S&P 500 forecasting and anomaly detection.
- Forecast history and publication state are persisted in the repository.
Features and methods
- Multi-horizon returns, volatility, trends/moving averages, VIX, rates, FX and cross-asset relationships.
- Random Forest blended with rules for regime; Gradient Boosting for five-day probability and return.
- Isolation Forest plus z-scores for anomalies; risk-on model with GBM and Ridge/OLS fallback.
Validation and failure modes
- Temporal alignment of features and forward targets; rule fallback when history is insufficient.
- Track record for probability, expected return, direction and calibration on matured outcomes.
- Freshness, metric fingerprints, image-set hashes and duplicate blocking.
Runtime and delivery
- pandas, NumPy, yfinance, pandas_market_calendars, pandas_datareader and scikit-learn.
- matplotlib, ReportLab, Pillow, pytest, GitHub Actions and atproto.
10 · Operating timeline
Operating timeline
- Status: Active · experimental
- Frequency: Weekdays
- Page updated: July 2026
11 · Technical detail
Method and assumptions
Regime classification, supervised forecasting, Isolation Forest anomalies and a composite risk index.
Main failure modes
Unstable relationships, unseen shocks and the risk of over-simplifying heterogeneous conditions.
See real outputs
The Publications page reads the public Bluesky feed and shows up to three recent runs, including multiple images in one post.
Potential transferability
Have a problem similar to Market Overview?
A first discussion can start from the objective, available data and success criterion without sending confidential information. A result observed here is not assumed to transfer automatically to another context.