Plain-language summary
- What it solves
- Whether refining oil is profitable at a given moment, and how wrong the forecast turns out to be.
- Who it can serve
- Anyone following energy markets, and anyone who wants to see a forecasting system that publishes its own errors.
- What it produces
- The current margin, forecasts over several horizons, and a track record of past errors.
Track a complex energy indicator without separating the forecast from later verification.
3 · What it produces
Margin snapshot, M+1/M+2/M+3 forecast and matured error metrics.
How to read the latest output: A high percentile describes the margin level versus history; it is not automatically a bullish forecast.
4 · How it works
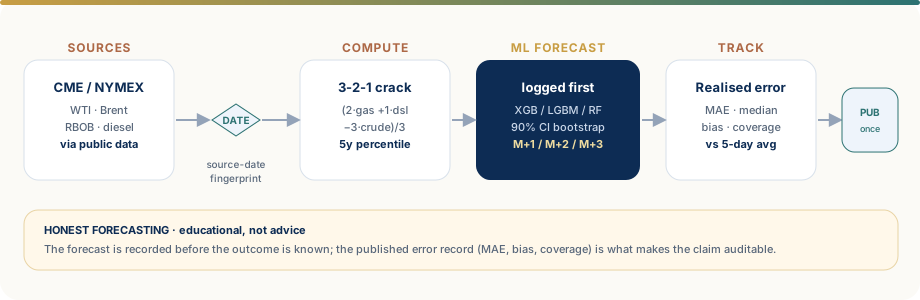
From sources to output.
5 · Data used
| Source | Variable | Frequency | Limitation |
|---|---|---|---|
| Yahoo Finance / public contracts | WTI, Brent, RBOB, diesel and context variables | Weekly | Market proxies; rolls and revisions possible |
Models and rules
3-2-1 crack spread, lagged and rolling features, tree-model selection, temporal split and bootstrap intervals.
Controls
Source-date checks, fingerprints, hashes, ex-ante forecast registration and separate outcome maturation.
Results and metrics
MAE, median error, bias and interval coverage, always with period and matured sample size.
Limits
Gross-margin proxy; real refinery costs are excluded; data relationships can change.
Possible applications of the pattern
Energy KPI with forecast and track record
Possible applications: energy or industrial KPIs with multiple horizons, baselines, intervals and matured errors. Economic KPI definition must precede modelling.
Transferable components
- futures and FX alignment
- 3-2-1 crack calculation
- point-in-time lags and rolling features
- ex-ante forecast registration
Research questions
- proxy stability
- model comparison
- interval coverage
- residual drift
Workflow technical dossier
IMPLEMENTEDDescribes behaviour present in the workflow.EXTENSIONIndicates a possible check or evolution, not an operating feature.
Implementation detail and assessment criteria.
This section connects the visible output to data-engineering, modelling, validation and delivery choices present in the repository.
Architecture and data
- Download of energy futures, EUR/USD and equity proxies; Parquet persistence and CSV forecast history.
- 3-2-1 crack calculation with consistent per-barrel and metric-ton conversions.
- Orchestrator separated from forecasting, charts, HTML/PDF reports and Bluesky publishing.
Features and methods
- 14-day lags, 5/10/21 rolling statistics, calendar dummies, ROC momentum and exogenous variables.
- Automatic selection among XGBoost, LightGBM and Random Forest using test MAE.
- Recursive M+1/M+2/M+3 forecasts with exogenous values held at the latest observation.
Validation and failure modes
- Five-fold TimeSeriesSplit and a final three-month holdout.
- 90% intervals from residual bootstrap and forecast registration before outcomes.
- Freshness gate, metric fingerprints, SHA-256 and visual hashes for social cards.
Runtime and delivery
- pandas, NumPy, yfinance, scikit-learn, XGBoost, LightGBM, statsmodels and PyArrow.
- ReportLab/Pillow/matplotlib, GitHub Actions, email and AT Protocol.
10 · Operating timeline
Operating timeline
- Status: Active · experimental
- Frequency: Weekly
- Page updated: July 2026
11 · Technical detail
Method and assumptions
3-2-1 crack spread, lagged and rolling features, tree-model selection, temporal split and bootstrap intervals.
Main failure modes
Gross-margin proxy; real refinery costs are excluded; data relationships can change.
Publication governance
Source-date checks, fingerprints, hashes, ex-ante forecast registration and separate outcome maturation.
See real outputs
The Publications page reads the public Bluesky feed and shows up to three recent runs, including multiple images in one post.
Potential transferability
Have a problem similar to The New Margin?
A first discussion can start from the objective, available data and success criterion without sending confidential information. A result observed here is not assumed to transfer automatically to another context.