Two levels: basic and advanced
In plain words
In summer, ice-cream sales go up and so do drownings. Banning ice cream would save nobody: both depend on the heat, which sends more people to the beach. Heat is the uninvited third party, what statisticians call a confounder.
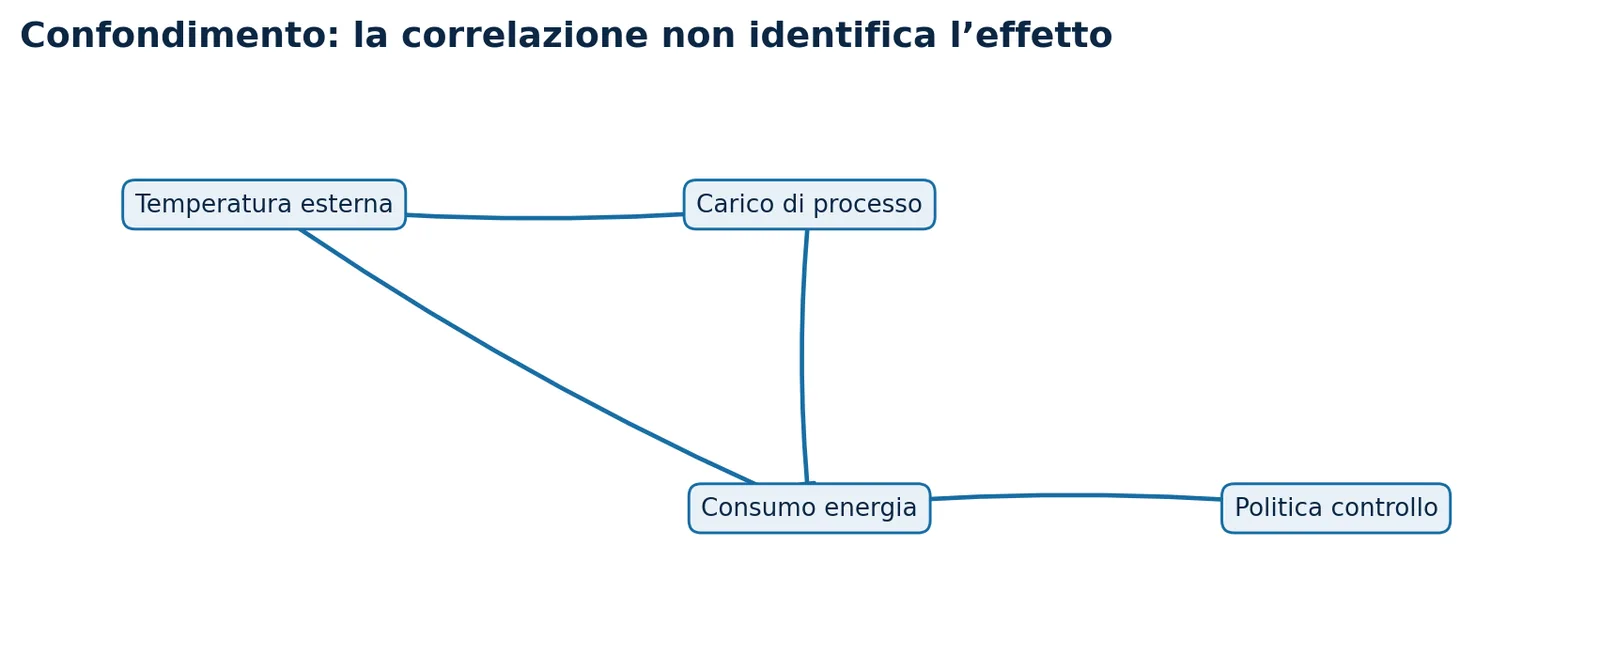
Industrial data are full of this. A plant’s energy use rises right after a new control policy, but in the same weeks the outdoor temperature and the production load changed too. If we credit or blame the policy for everything, we judge a choice on merits it doesn’t have.
Going deeper
Predicting, explaining and intervening are three different questions. A stable correlation is enough to predict; to intervene you need the causal effect, that is what happens if you force a variable. A confounder opens a spurious path between cause and effect and biases the estimate, however much data you have.
Practical tools: draw a causal graph (DAG) before the analysis and decide which variables to condition on; use randomised experiments or A/B tests where possible; otherwise, quasi-experimental methods (difference-in-differences, instrumental variables, regression discontinuity) with stated assumptions. Beware of the opposite mistake: conditioning on a collider creates correlations that don’t exist.
Causal effect ≠ E[Y | X = x] when a confounder Z affects both X and Y; you need E[Y | do(X = x)]Key takeaway: To change an outcome it’s not enough to know what moves together: you need to know what causes it.