Two levels: basic and advanced
In plain words
A maintenance sensor catches 9 failures out of 10 and is wrong only 5% of the time on healthy machines. The alarm goes off: how likely is a real failure? Most people say “90%”. If failures are rare (1 machine in 100), the right answer is about 15%.
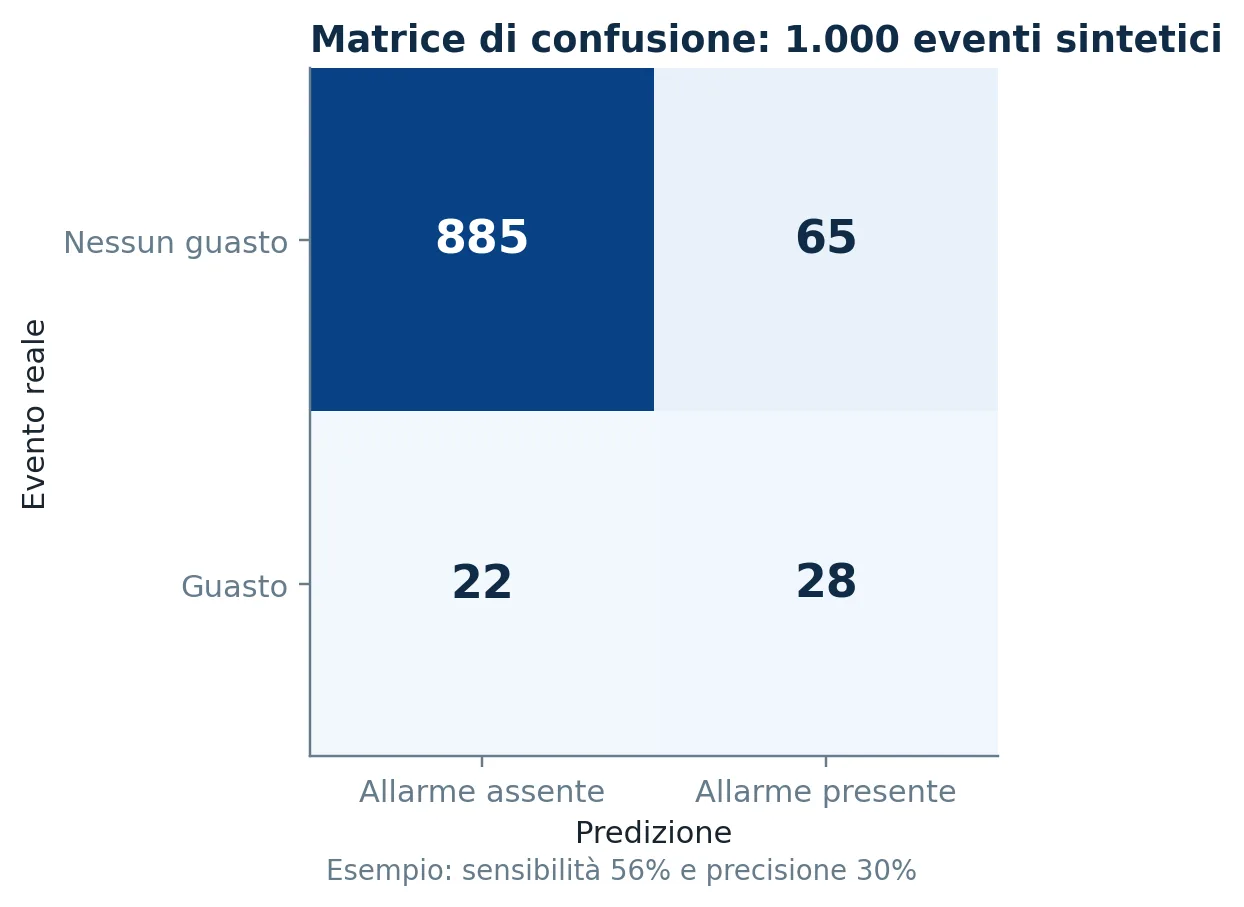
The numbers make it obvious. Out of 1,000 machines, 10 are faulty and the sensor finds 9. But 5% of the 990 healthy ones also trigger the alarm: almost 50 false alarms. About 58 alarms in total, only 9 real. When an event is rare, even a good test produces many false positives. It holds for machines, medical tests and volcanic alerts alike.
Going deeper
This is the base-rate problem. With prevalence P(F) = 0.01, sensitivity P(A|F) = 0.90 and false-alarm rate P(A|¬F) = 0.05, Bayes’ theorem gives P(F|A) ≈ 0.154. What the operator cares about is the positive predictive value (precision), not sensitivity.
Design consequences: always evaluate precision and recall at the site’s real prevalence, not on an artificially balanced dataset; state the prevalence used in validation; prefer two-stage systems (a sensitive first filter, then a more specific confirmation) when false alarms are expensive. If prevalence changes, precision changes too, even with the very same model.
P(F|A) = P(A|F)·P(F) / [P(A|F)·P(F) + P(A|¬F)·P(¬F)] = 0.009 / 0.0585 ≈ 0.154Key takeaway: With rare events, always ask: out of 100 alarms, how many are real?