Start from the output
Open the project overview and interpret the latest card before entering the models.
Workflow portfolio
A scalable catalogue driven by one workflow registry: filter the portfolio and open the dedicated method page.
How to read the portfolio
The portfolio collects the workflows the laboratory keeps in operation. Every card opens a page with the same structure, so two projects from different sectors stay comparable: the difference is in the data and the method, not in the way they are described.
Open the project overview and interpret the latest card before entering the models.
Each page connects data, features, validation, runtime and failure modes.
Use applications, results and profile pages to assess transferability and delivery capability.
Common structure
Every project starts from a concrete question, and the page states it immediately, together with what the workflow actually produces: a grid, a map, a card, a report.
The build comes next. Which sources go in, how they are checked, what method turns them into a result — and where the process stops by itself if the data is not sufficient.
What separates a demonstration from an exercise is the check: over which period it was evaluated, with which metrics, against which baseline, and at what stage of maturity it stands today.
The boundary closes it. Known limits, conditions where the result does not hold, published artefacts and possible applications. Not every item is always there: when an element is not relevant or not available, the page omits it rather than padding it.
A workflow’s inclusion in the portfolio documents research, experimentation or automation activity. It does not imply suitability for production, regulated, critical or decision-making uses.
Open results →Filter the portfolio
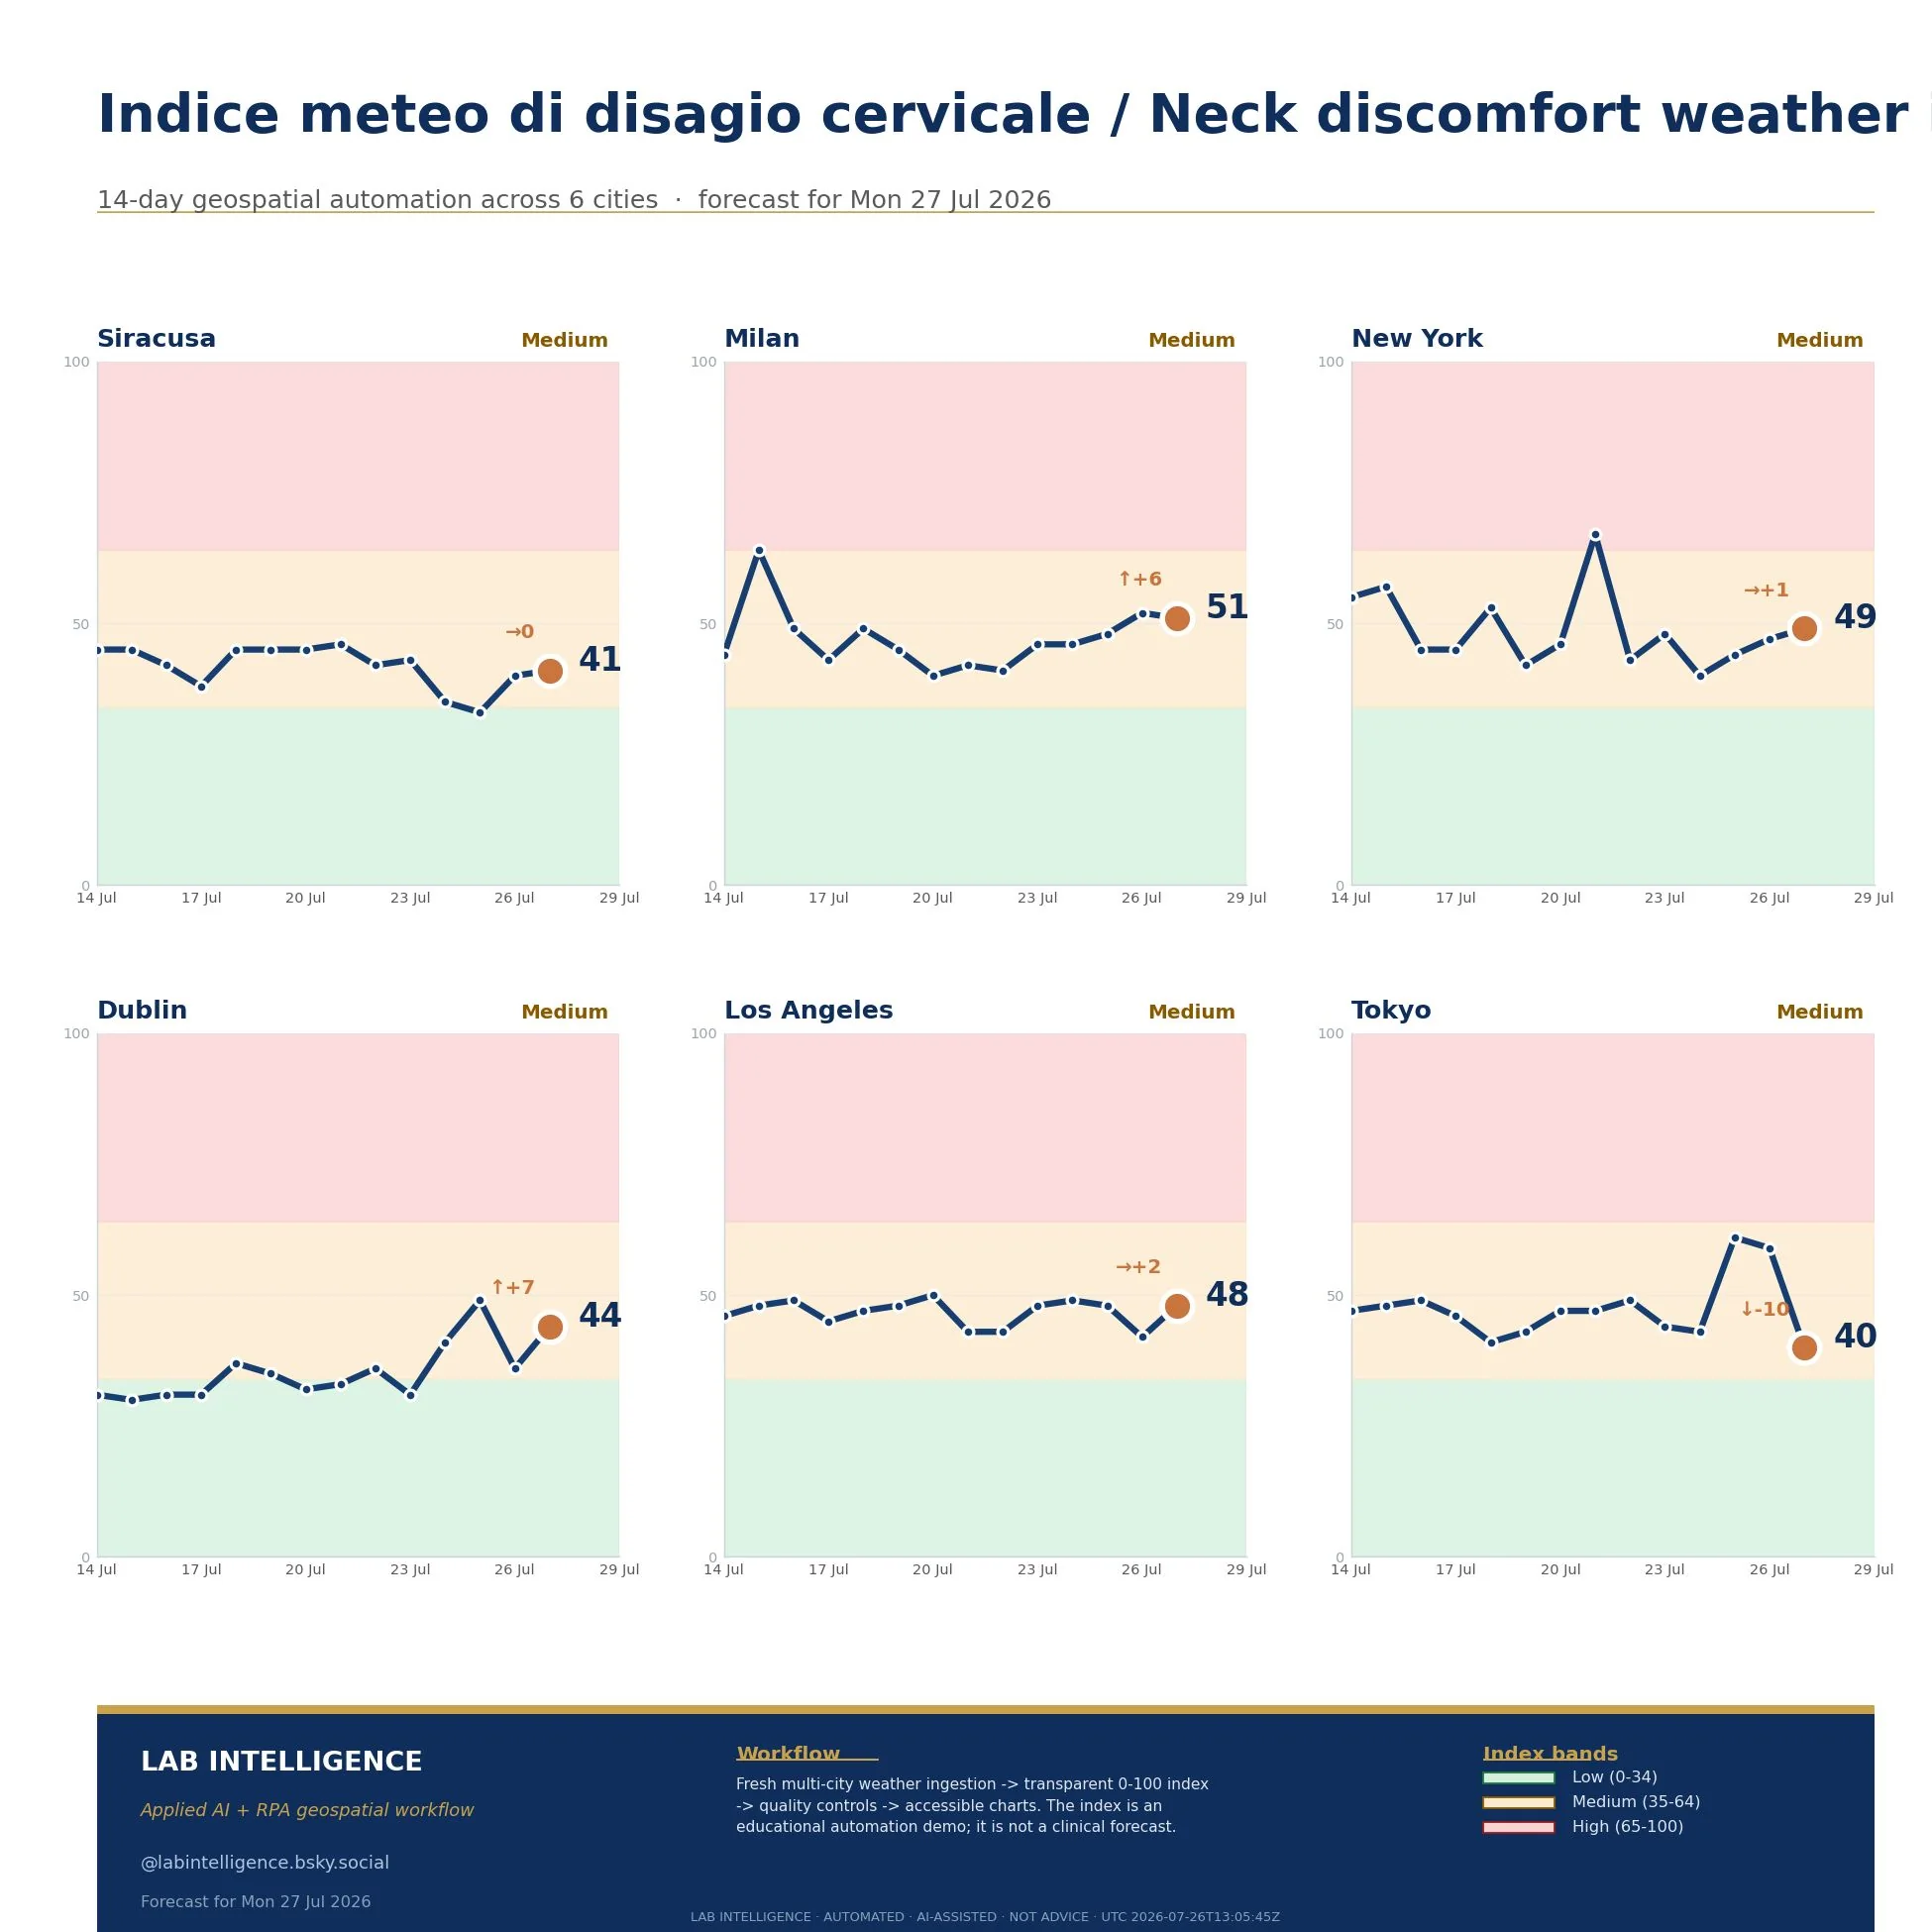
Turns public weather forecasts into an educational, readable and quality-controlled multi-city index.
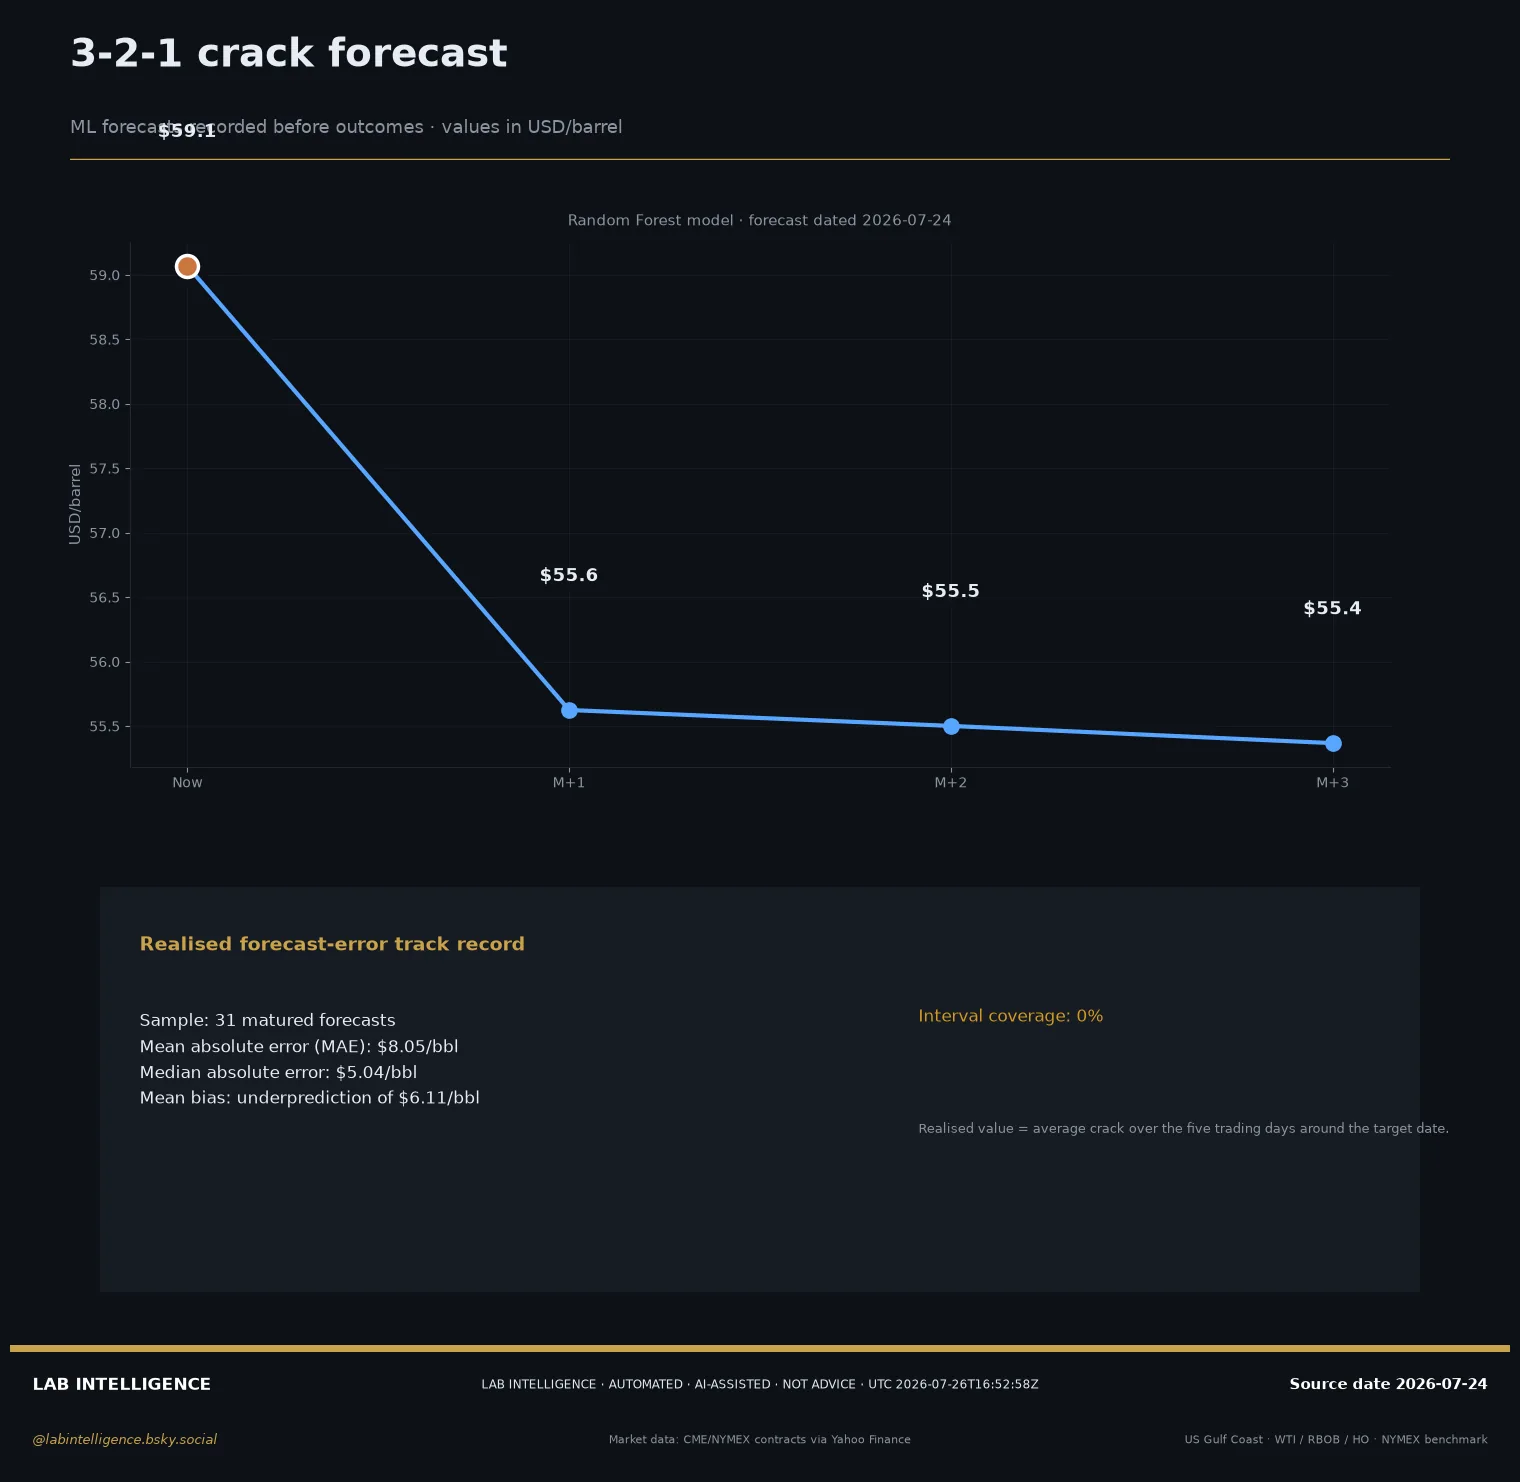
Measures the 3-2-1 crack spread, produces multi-horizon forecasts and preserves a mature-error track record.
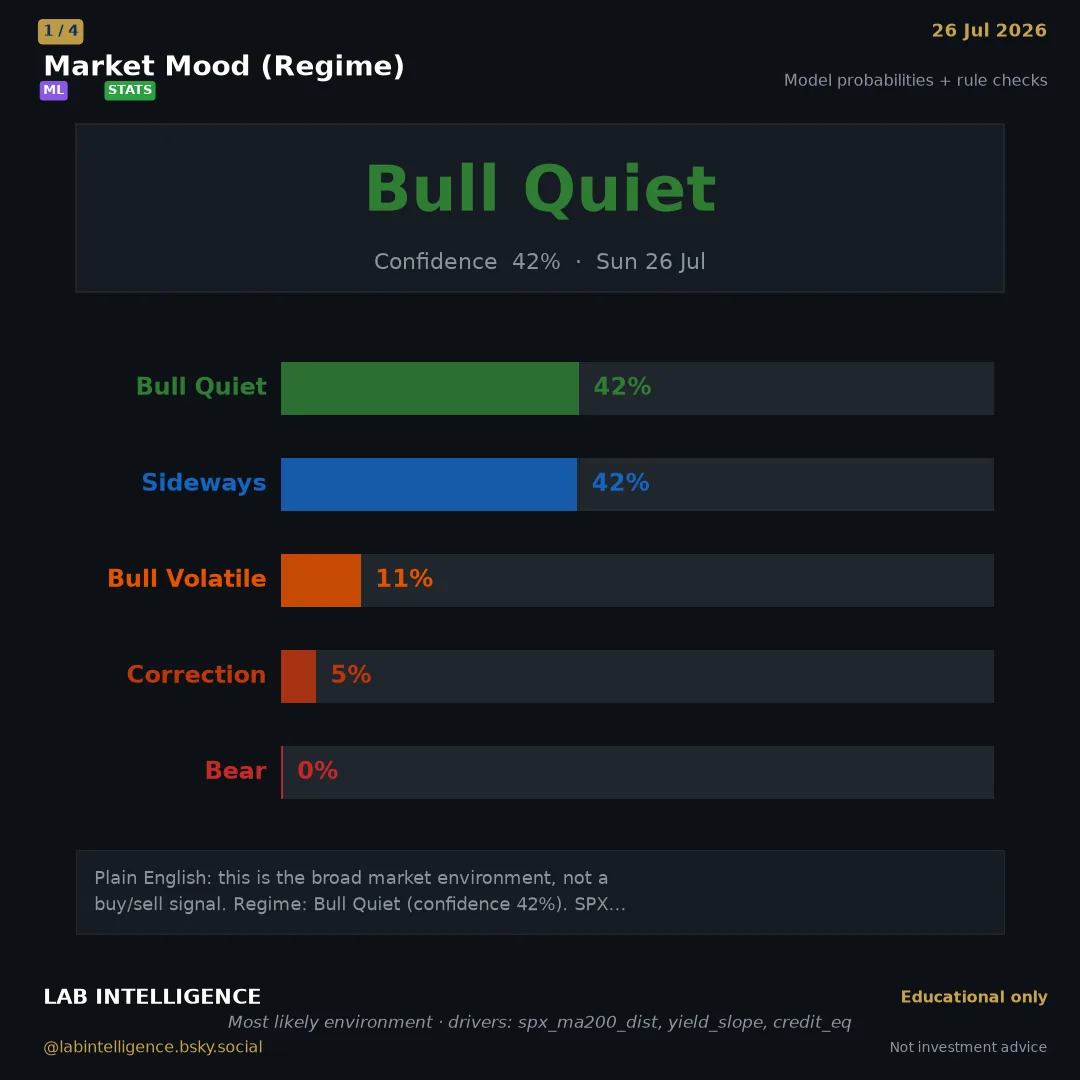
Condenses cross-asset signals into regime, forecast, anomalies and a risk-on/risk-off view while keeping uncertainty visible.
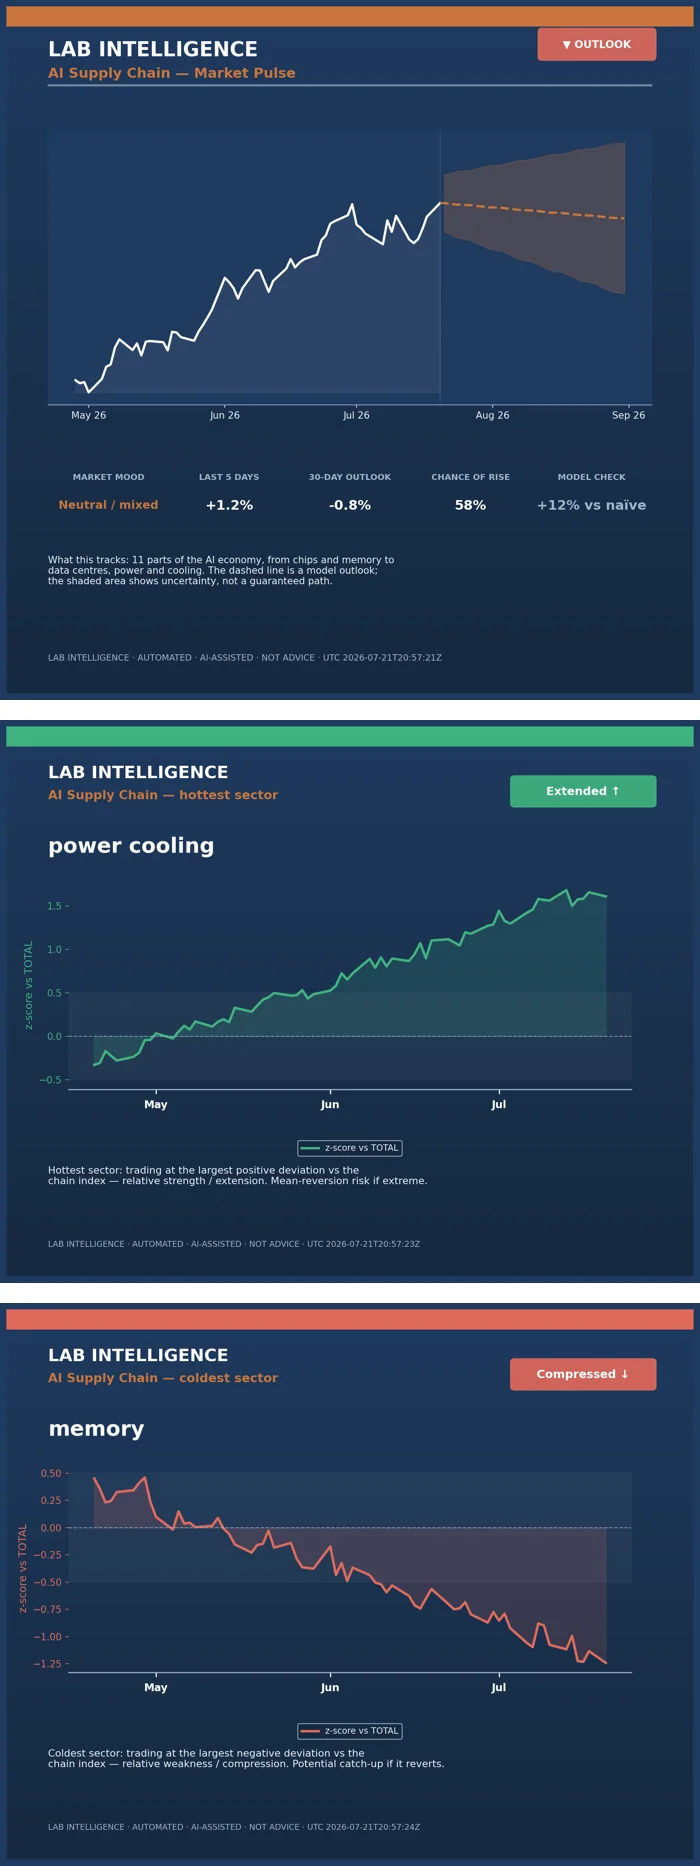
Reads the AI economy as a network of semiconductors, memory, data centres, power and cooling.
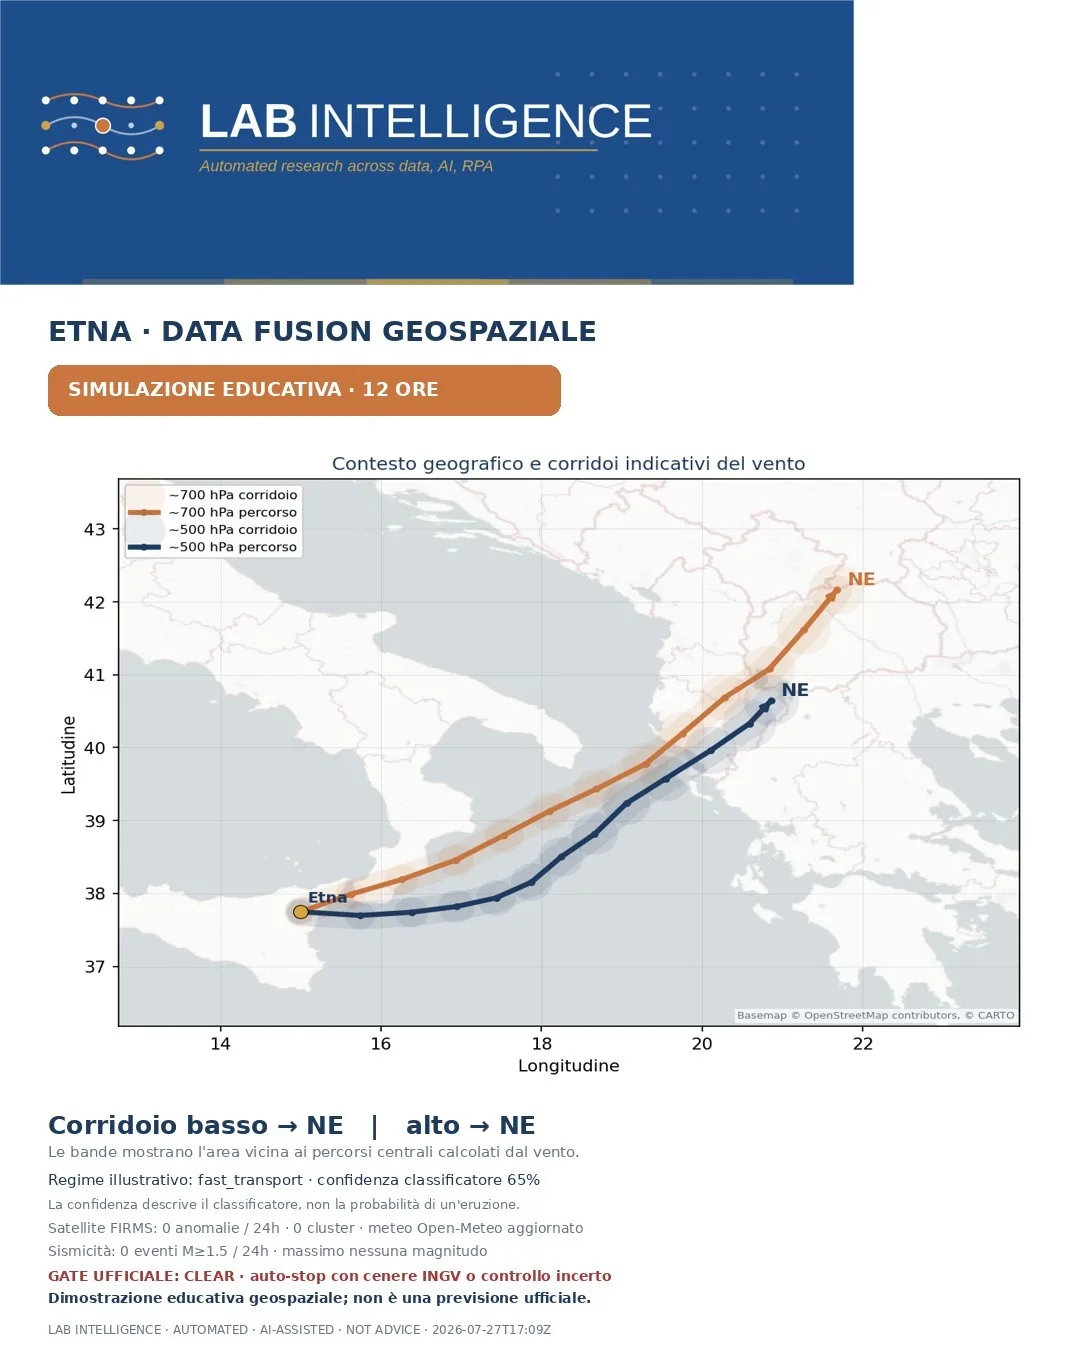
A public Etna event triggers multi-source fusion and two indicative 12-hour atmospheric trajectories.
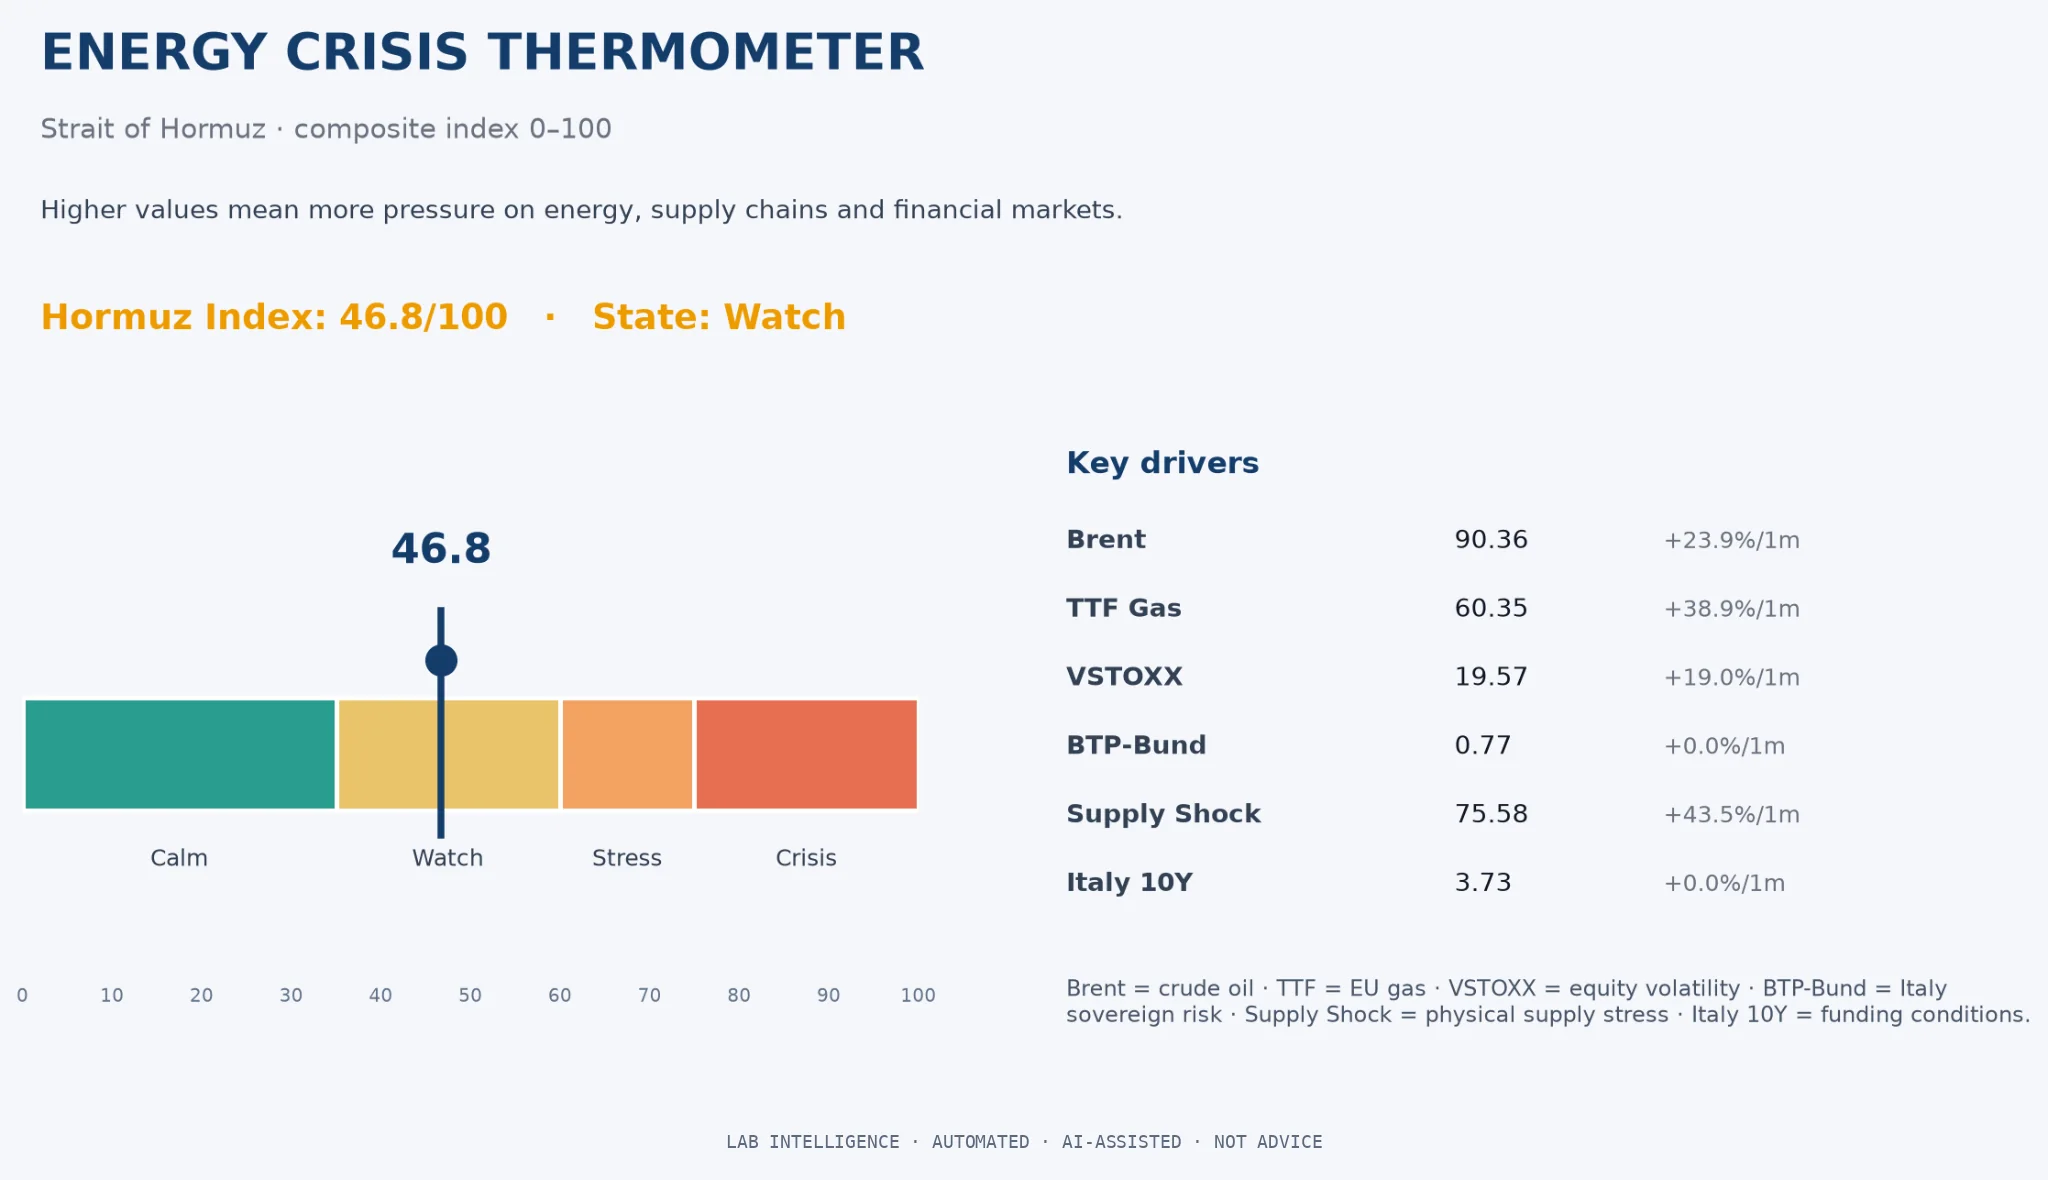
Combines energy, logistics and financial stress into a traceable 0–100 index with drivers, forecast and state machine.
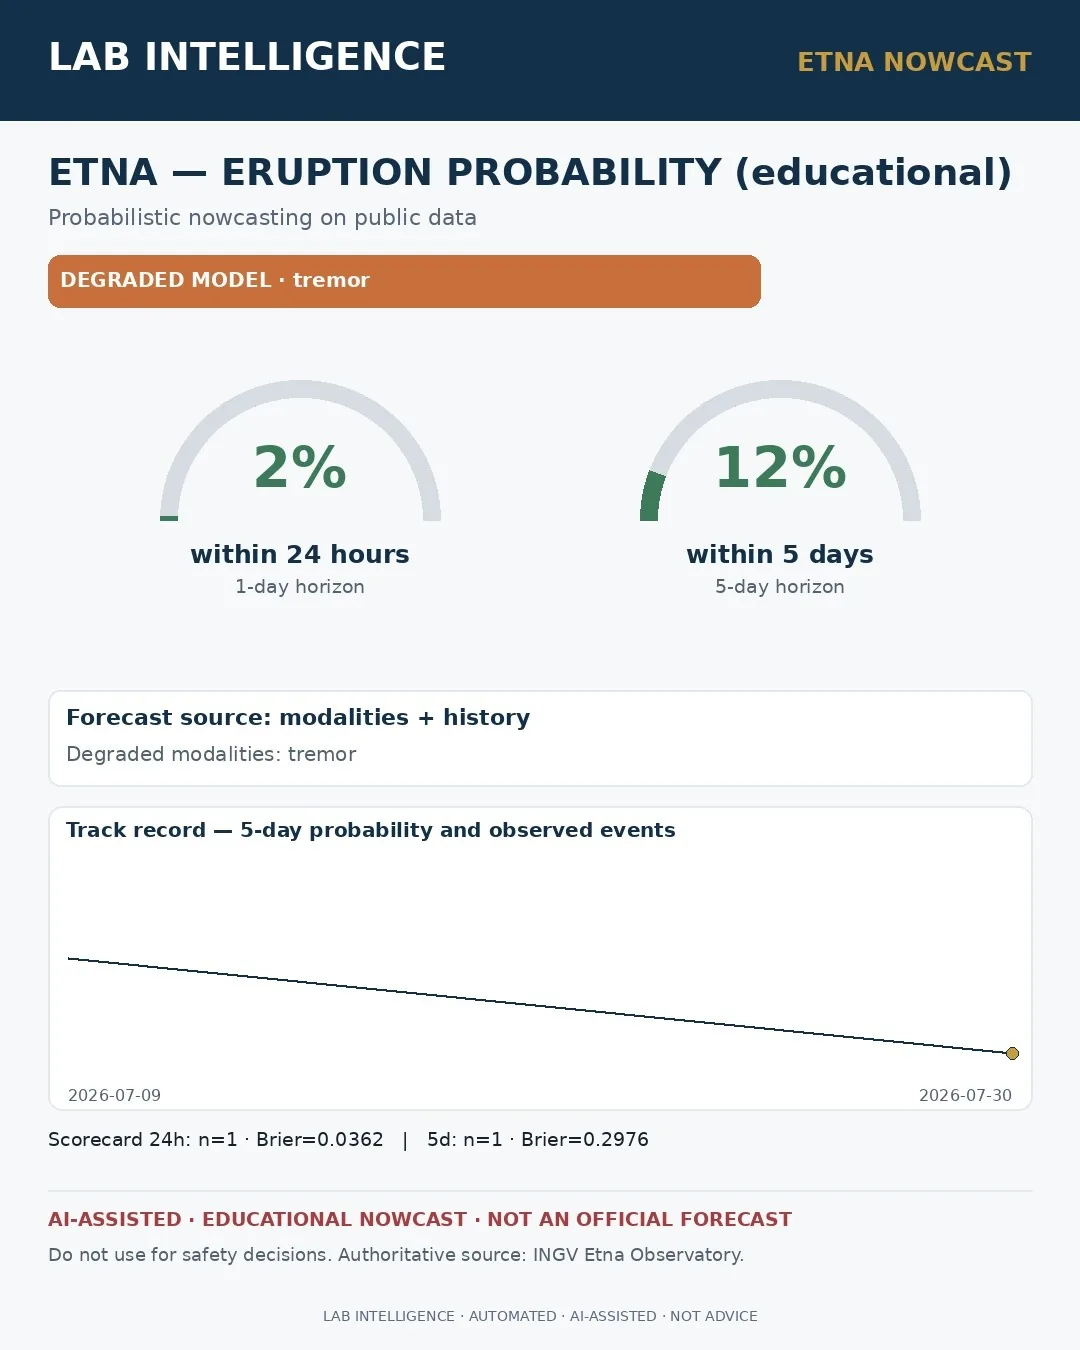
24-hour and 5-day probabilistic nowcasting with public multimodal data, strong baselines, a modality gate and declared degradation.
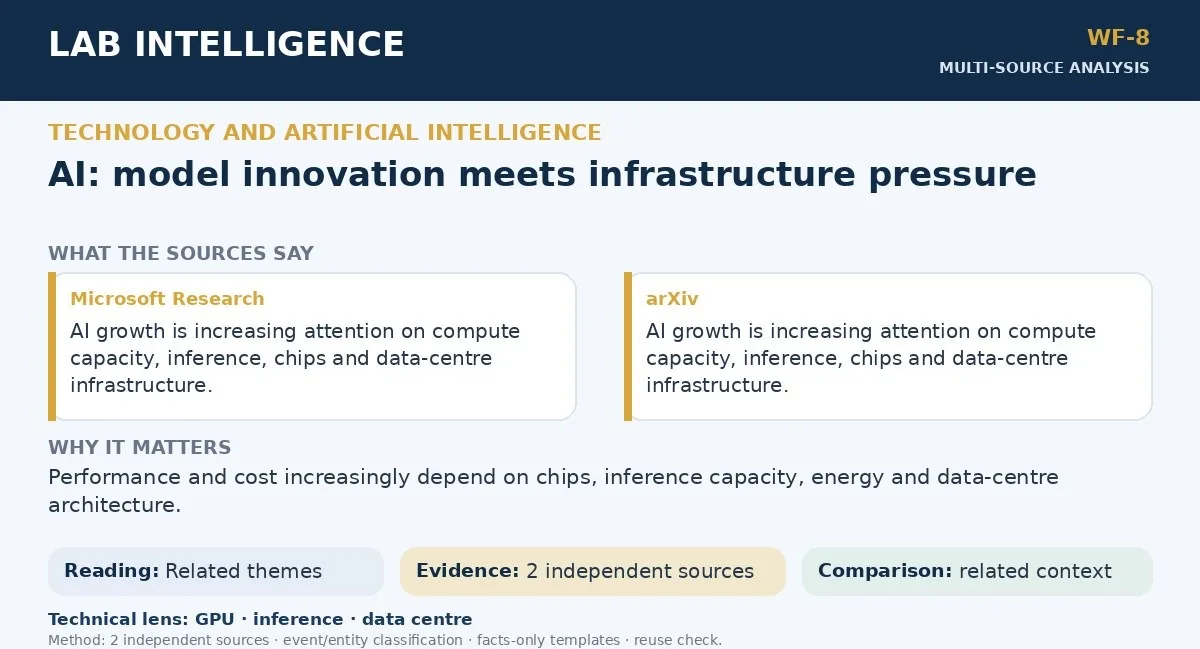
Turns independent technology/AI and energy sources into bilingual Bluesky posts with original cards, traceability and copyright-aware controls.
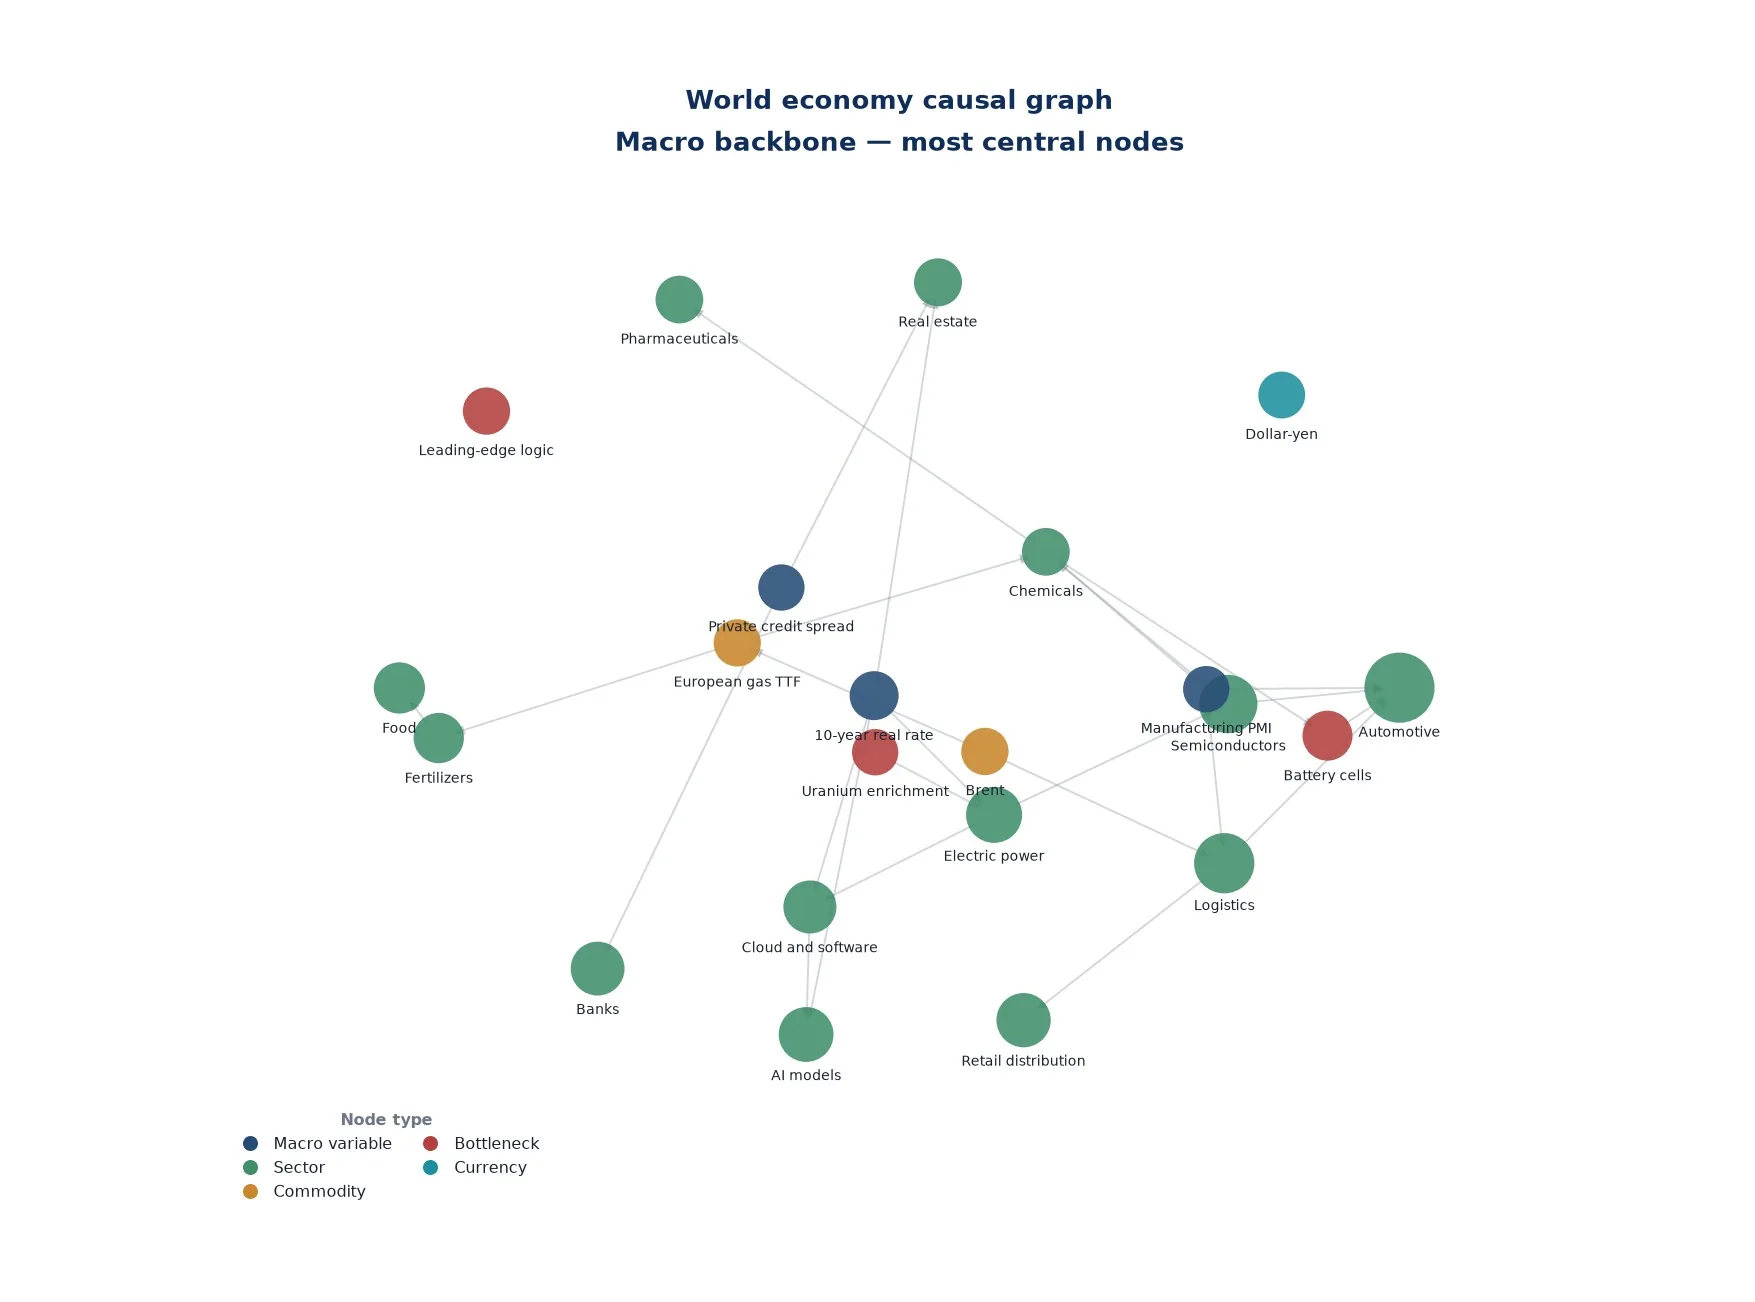
Integrates macro and market data into a Global Economy Pulse, time-causal regimes, a structural graph, scenarios and forecasts with prequential selection, benchmarks and uncertainty intervals.
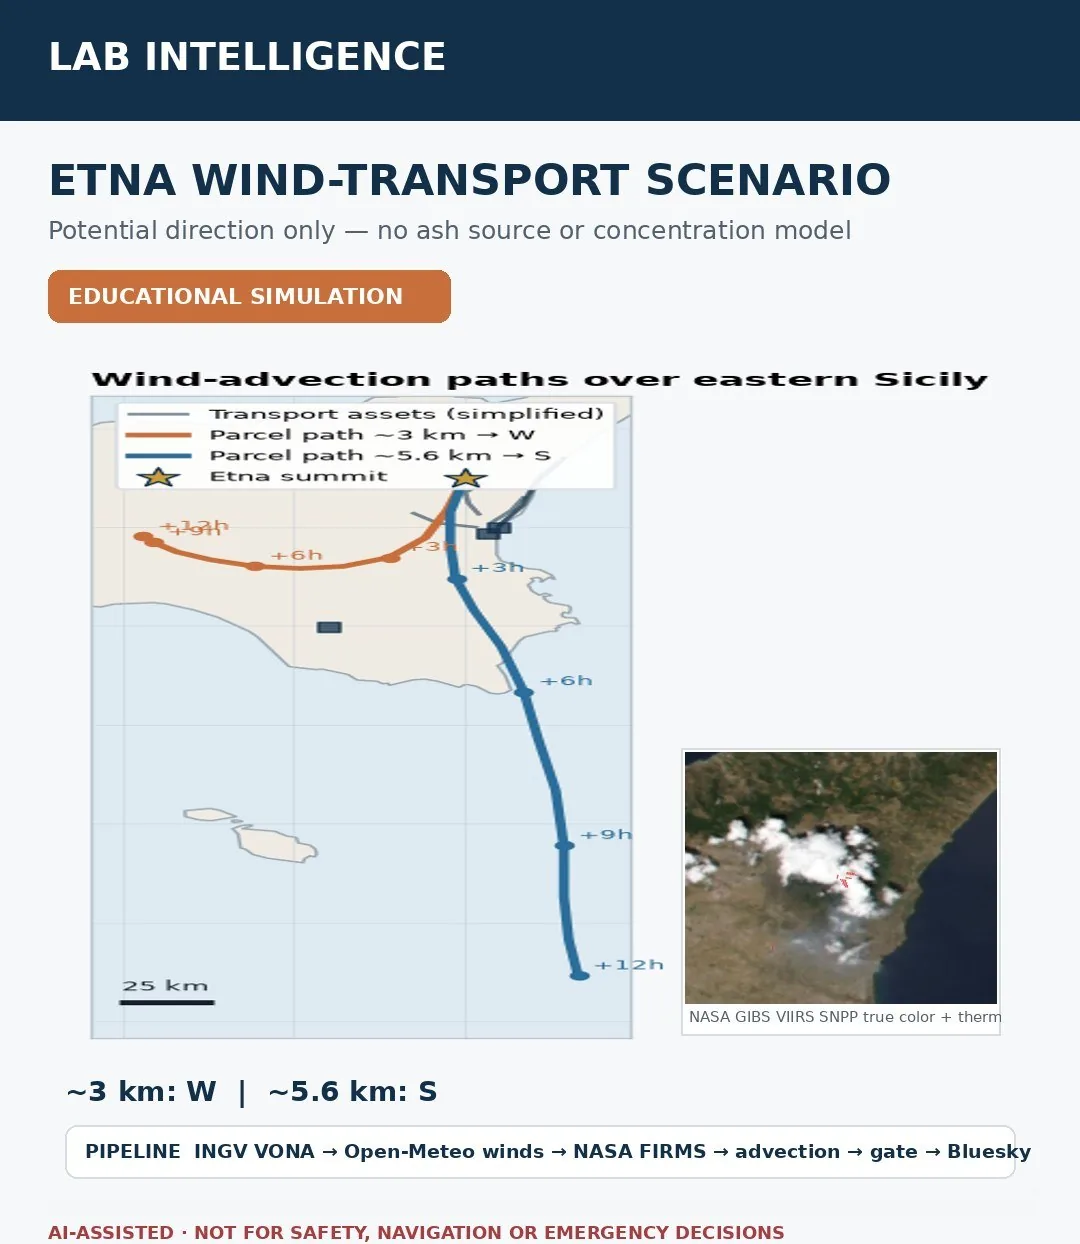
Automated relay of official VONA notices plus an educational wind-transport simulation combining INGV, Open-Meteo, NASA FIRMS/GIBS, pressure-level trajectories, infrastructure proximity and safety gates.
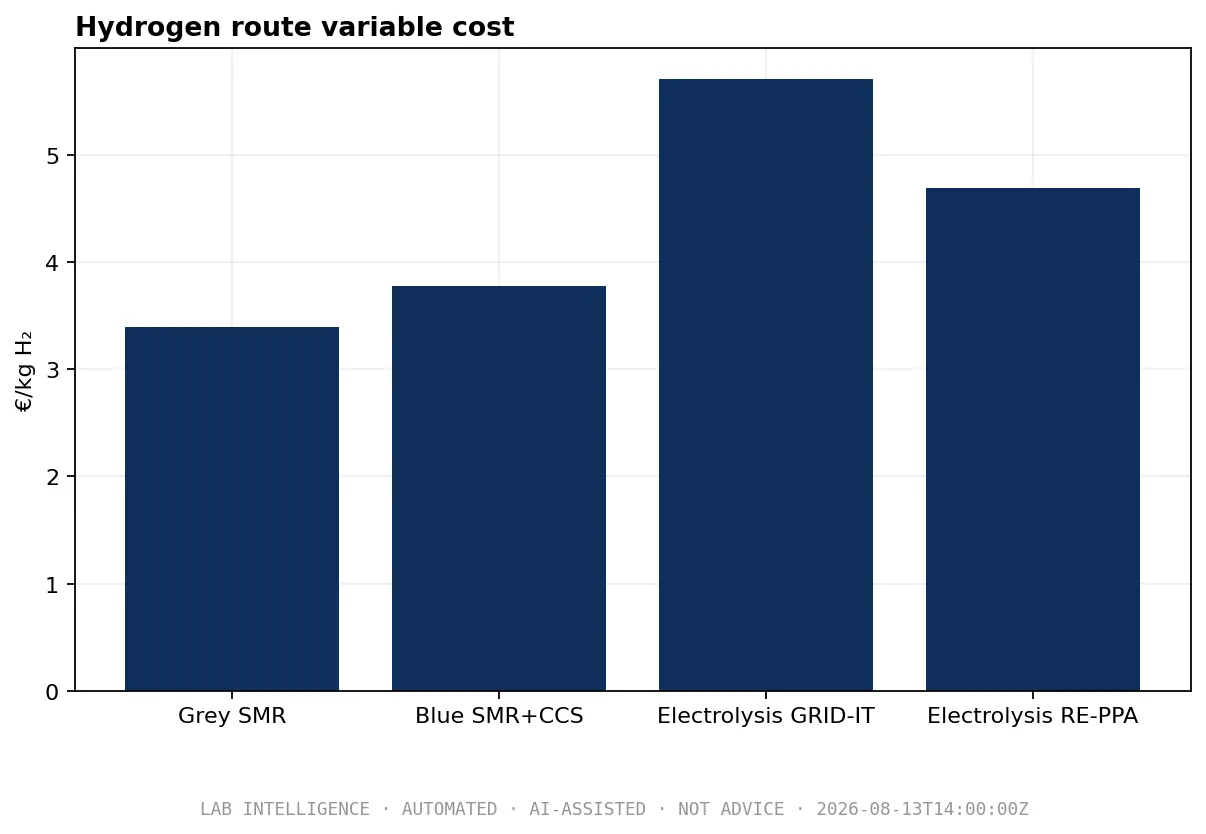
Compares grey SMR, SMR+CCS and electrolysis using public/configured energy prices, chemical balances, emissions boundaries and break-even thresholds.
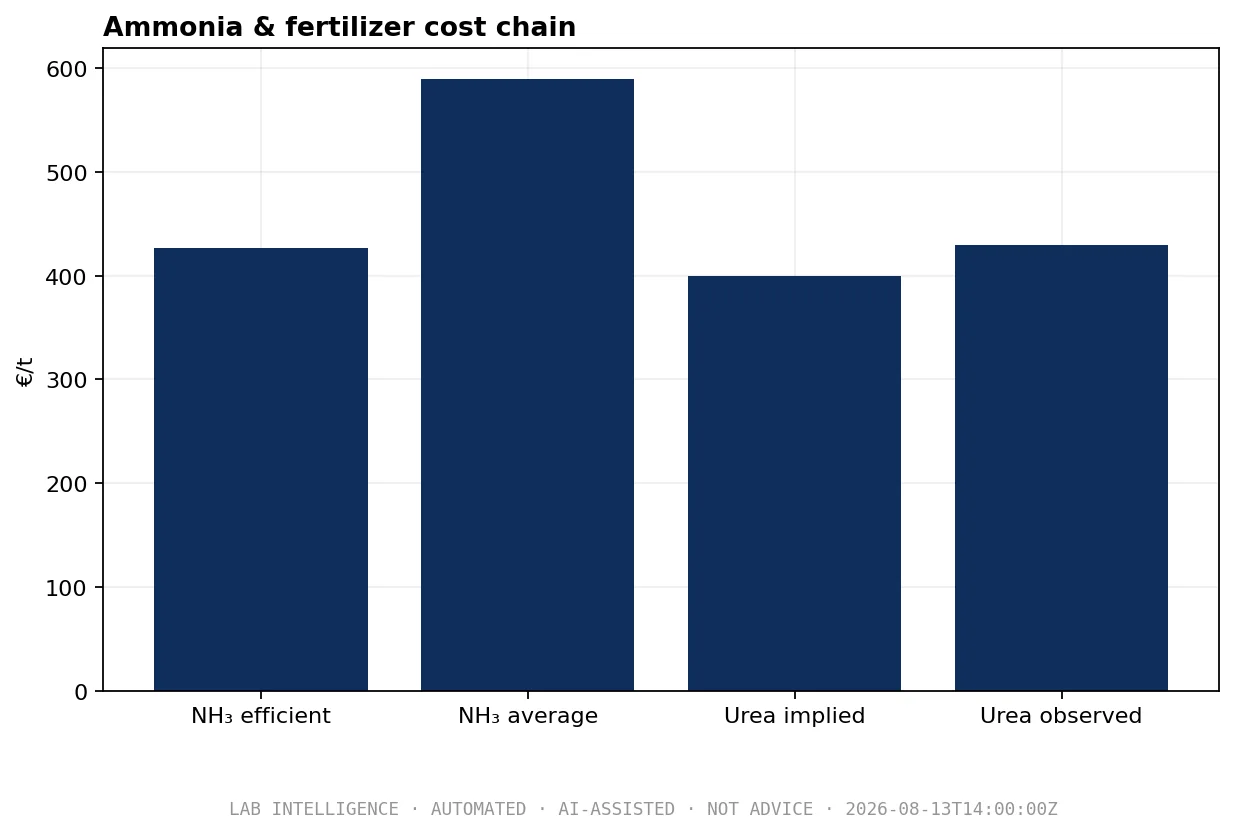
Propagates gas cost through the NH₃→urea chain while separating the physical calculation, nowcast and falsifiable M+1 forecast.
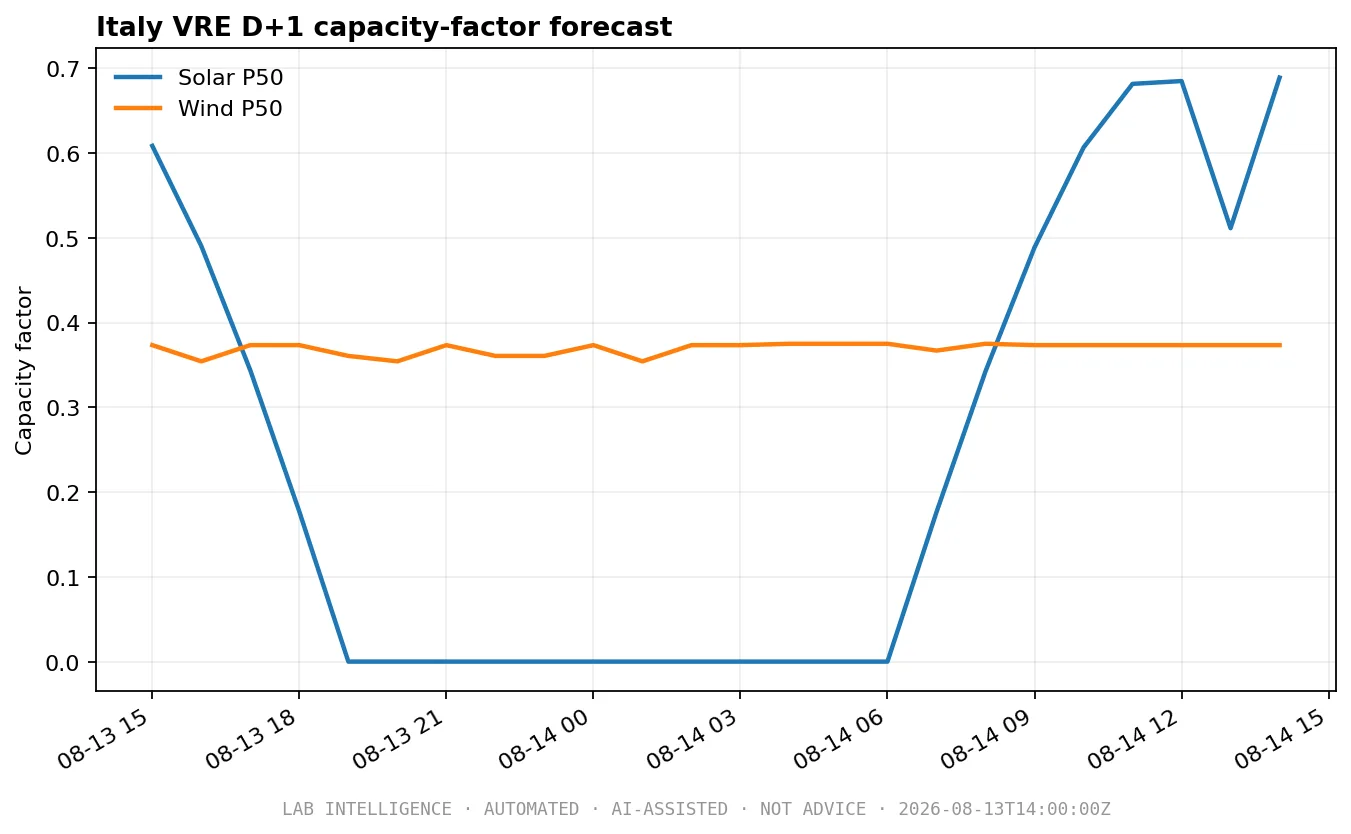
Forecasts the Europe/Rome D+1 civil day for solar, wind and total VRE, normalising by capacity and archiving point-in-time vintages.
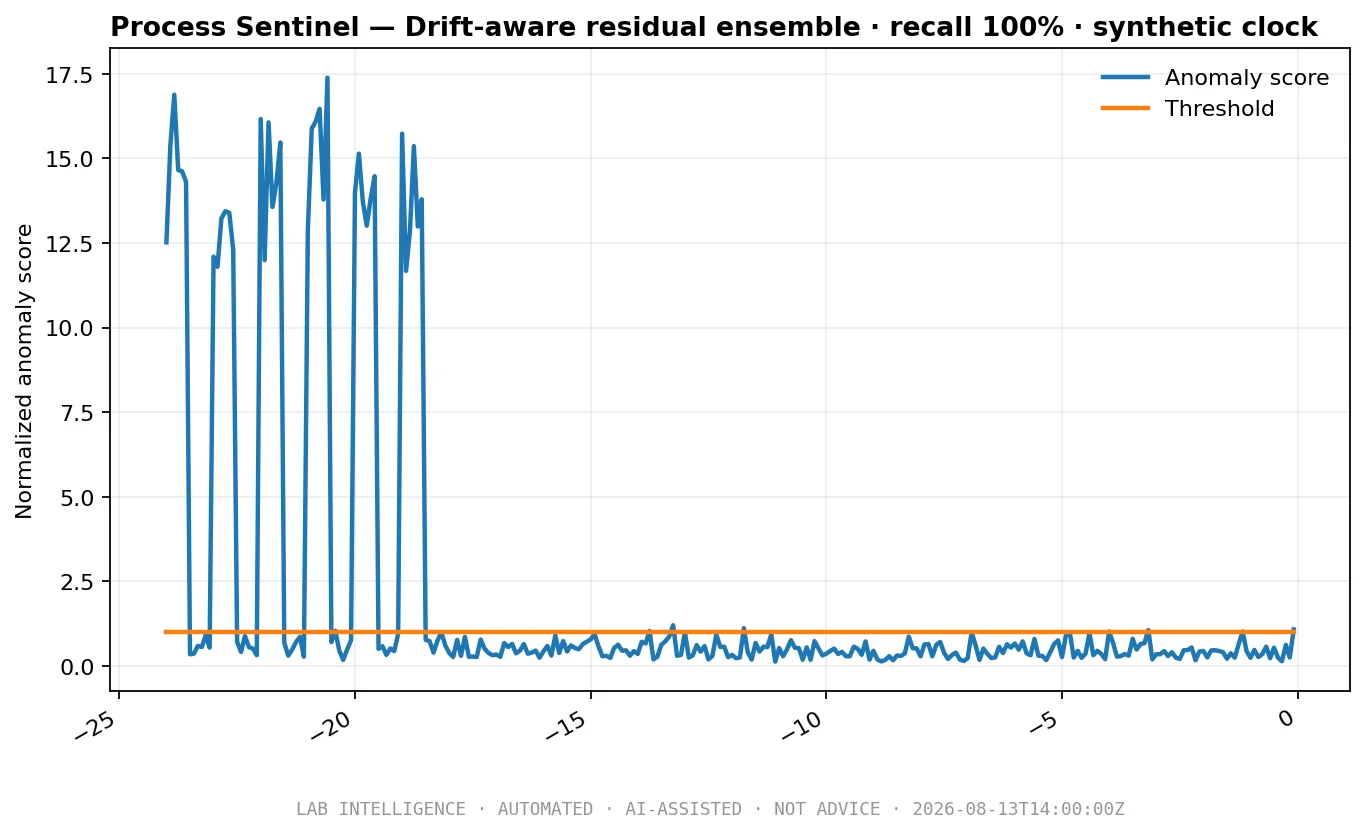
Detects anomalies and faults on a generic dynamic chemical process using a frozen 28-day synthetic data (simulated data) benchmark, isolated truth and a drift-aware PCA + process-residual ensemble.
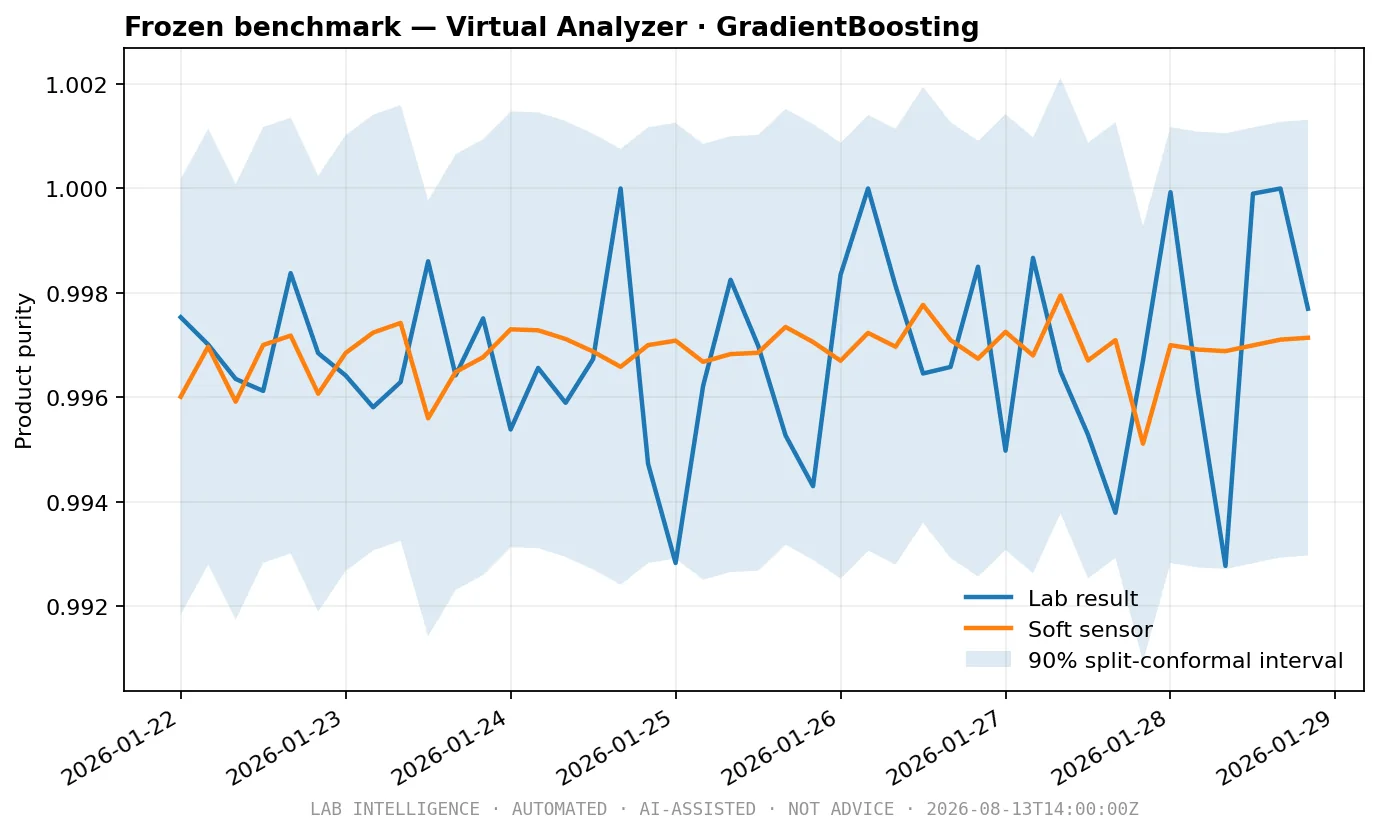
Experimental soft sensor on synthetic data (simulated data): estimates product quality between laboratory assays with delay, noise, point-in-time controls, OOD detection and measurable abstention.
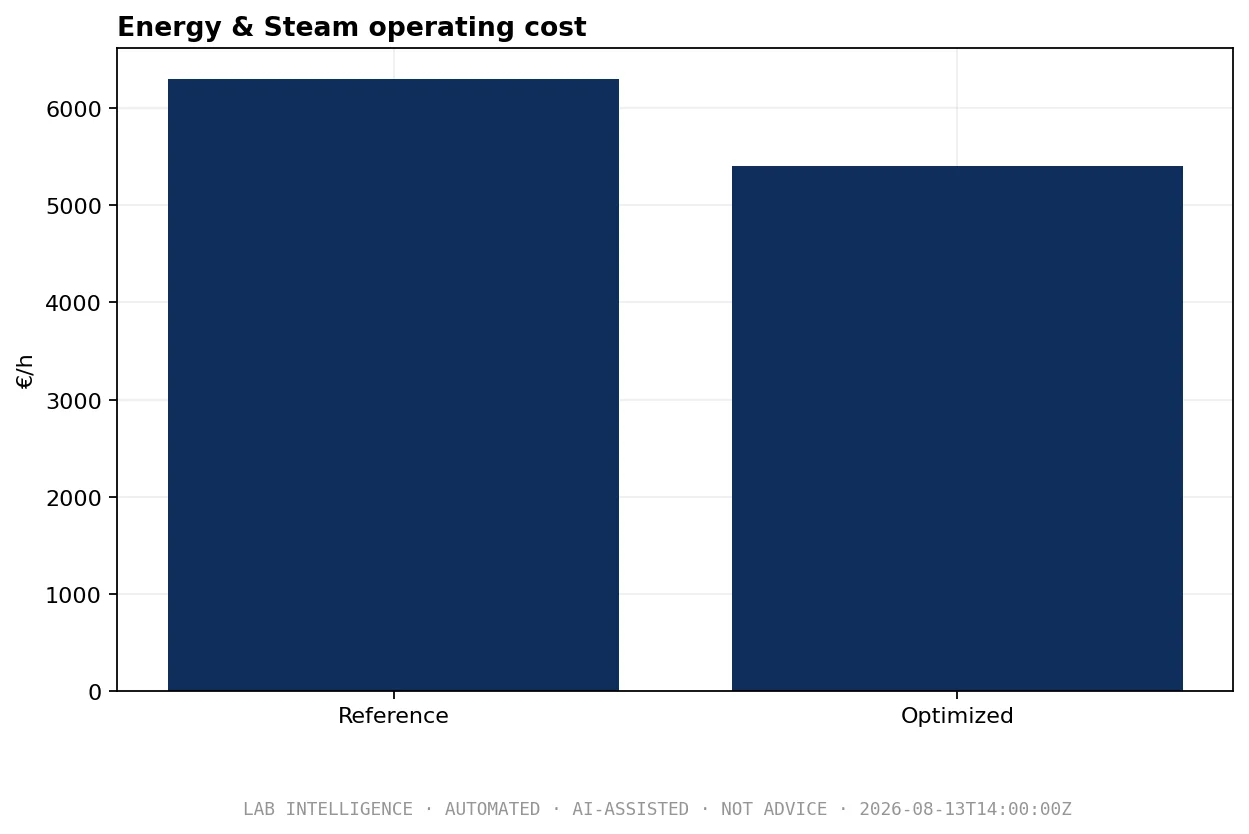
Optimises a modelled HP/MP/LP steam network with utility demand based on synthetic data (simulated data) and real/configured gas, power and carbon prices against a frozen reference dispatch policy.
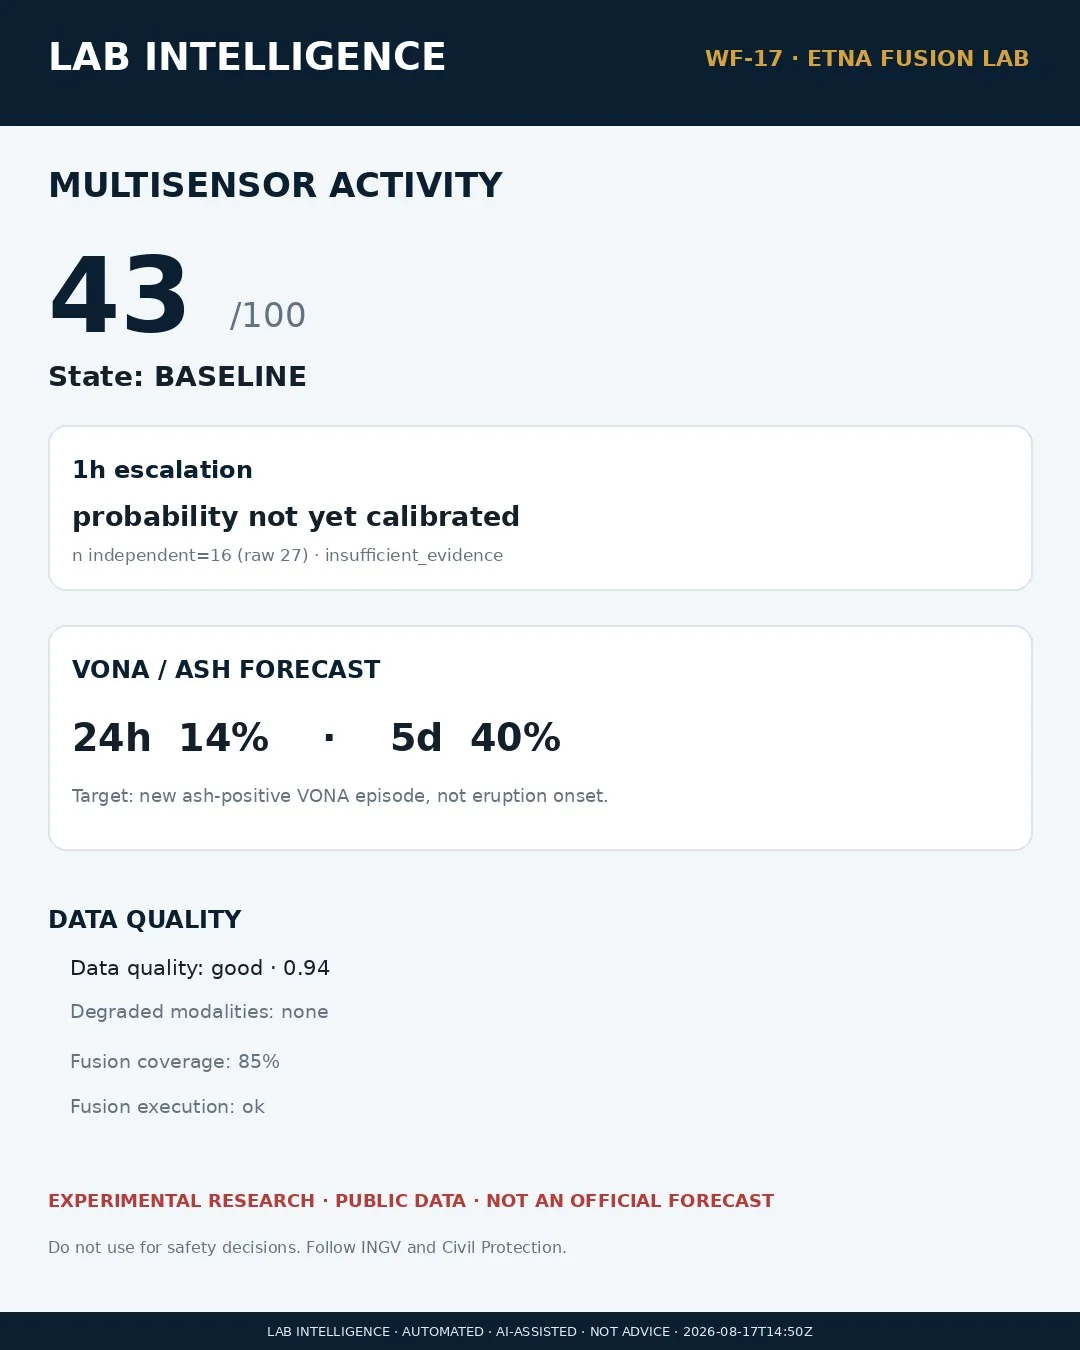
Fuses tremor, seismicity, thermal signals and event history with quality-adjusted weights; separates the 1h/6h Activity Nowcast from the 1d/5d VONA ash-positive forecast and keeps a prospectively verifiable ledger.
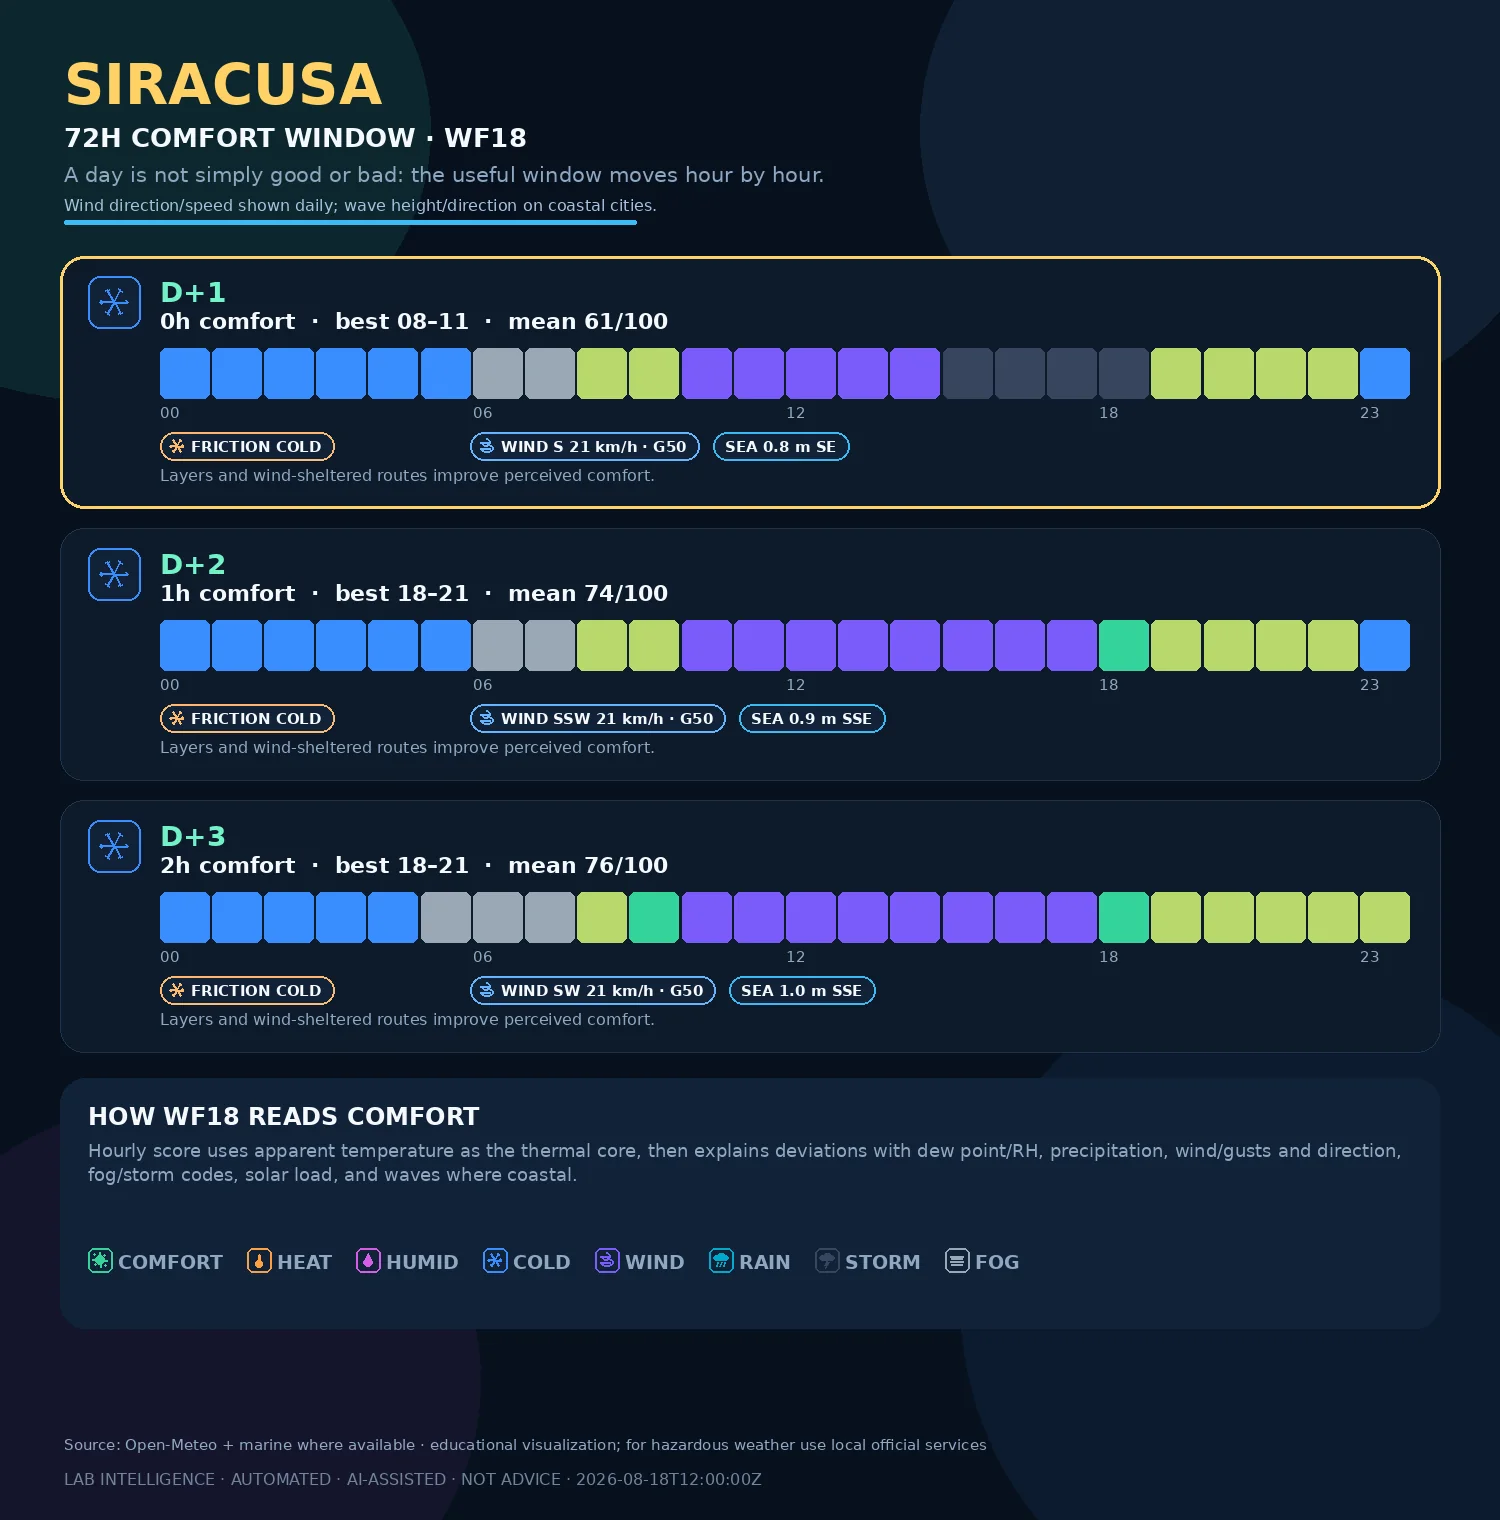
Turns 72-hour Open-Meteo forecasts into an hourly comparative outdoor-comfort map for 27 cities, with a permanent Siracusa focus, rotating city focus and explicit dominant issues.
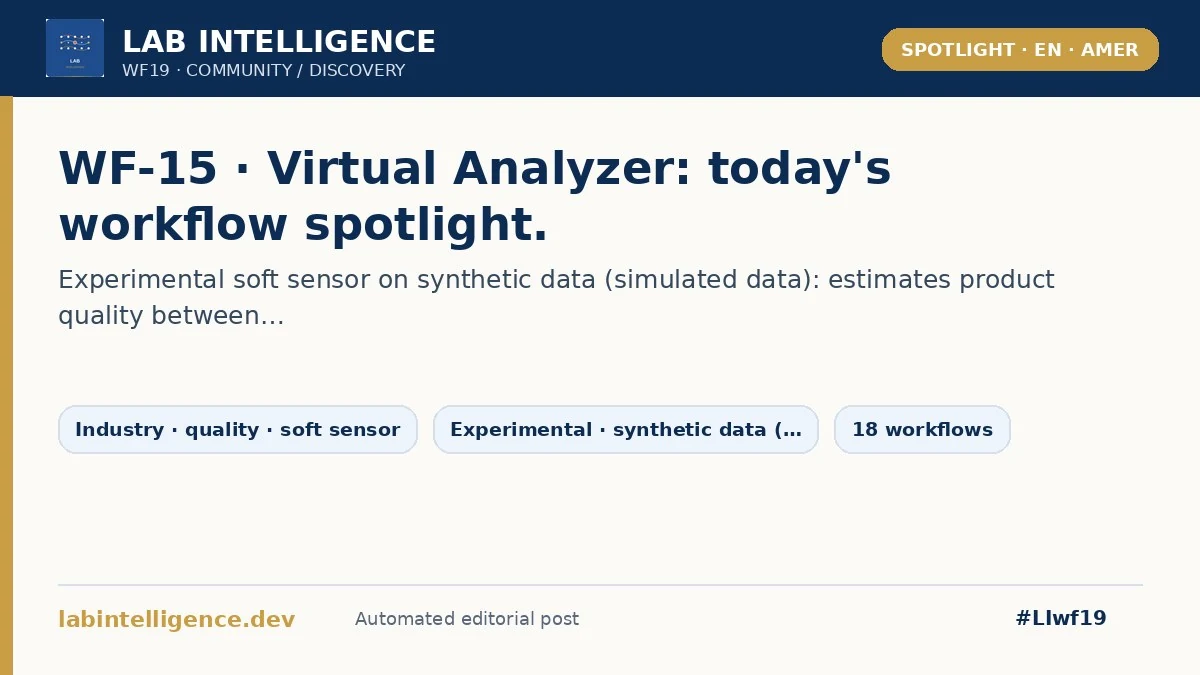
Bilingual editorial workflow that introduces the lab, rotates project spotlights, explains methods and controls, and asks community questions without inventing scientific results.
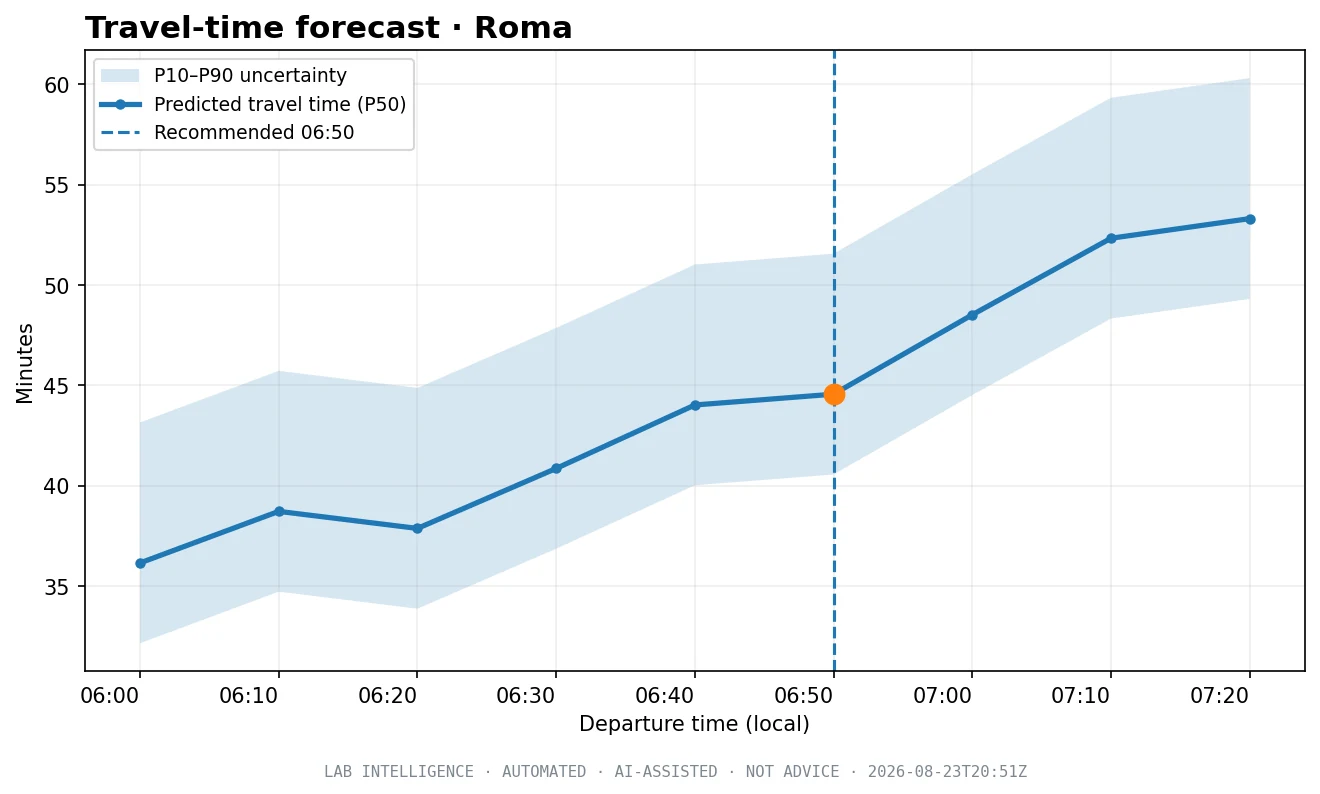
Educational workflow that compares traffic-aware routes and departure windows for public-service commuting scenarios, combining routing, weather, historical calibration, Random Forest after warm-up and P10/P50/P90 uncertainty.
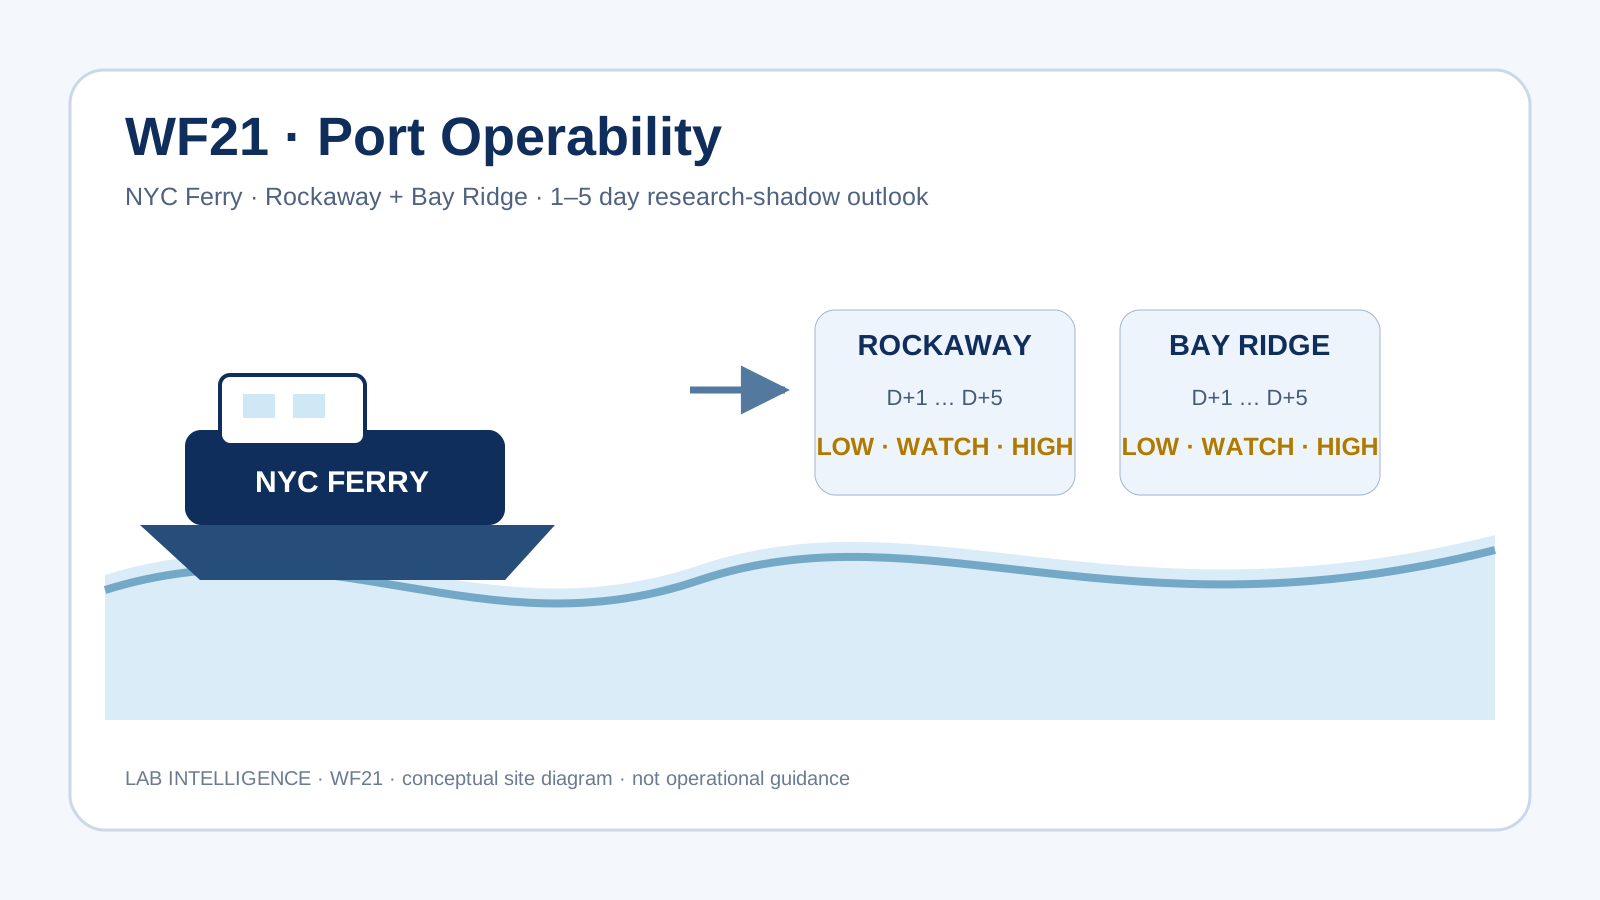
Research workflow that tries to anticipate, 1 to 5 days ahead, when weather and marine conditions may make operations critical at the NYC Ferry landings of Rockaway and Bay Ridge. It combines GFS and GEFS-Wave, LOW/WATCH/HIGH states, fail-closed controls and later verification against official NYC Ferry evidence.